

3D4LIFE Journals Results
CAD Computer Aided Design, Vol. 152, Num. 103370, pp 1--11, 2022.
DOI: http://dx.doi.org/10.1016/j.cad.2022.103370
DOI: http://dx.doi.org/10.1016/j.cad.2022.103370
BibTeX
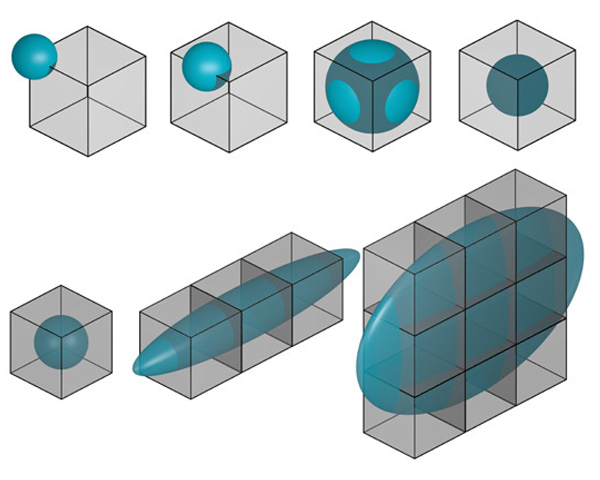
Herb Voelcker and his research team laid the foundations of Solid Modelling, on which Computer-Aided Design is based. He founded the ambitious Production Automation Project, that included Constructive Solid Geometry (CSG) as the basic 3D geometric representation. CSG trees were compact and robust, saving a memory space that was scarce in those times. But the main computational problem was Boundary Evaluation: the process of converting CSG trees to Boundary Representations (BReps) with explicit faces, edges and vertices for manufacturing and visualization purposes. This paper presents some glimpses of the history and evolution of some ideas that started with Herb Voelcker. We briefly describe the path from -localization and boundary evaluation- to -localization and printing-, with many intermediate steps driven by hardware, software and new mathematical tools: voxel and volume representations, triangle meshes, and many others, observing also that in some applications, voxel models no longer require Boundary Evaluation. In this last case, we consider the current research challenges and discuss several avenues for further research.
Computer-Aided Design, Vol. 146, pp 103189, 2022.
DOI: http://dx.doi.org/10.1016/j.cad.2021.103189
DOI: http://dx.doi.org/10.1016/j.cad.2021.103189
BibTeX
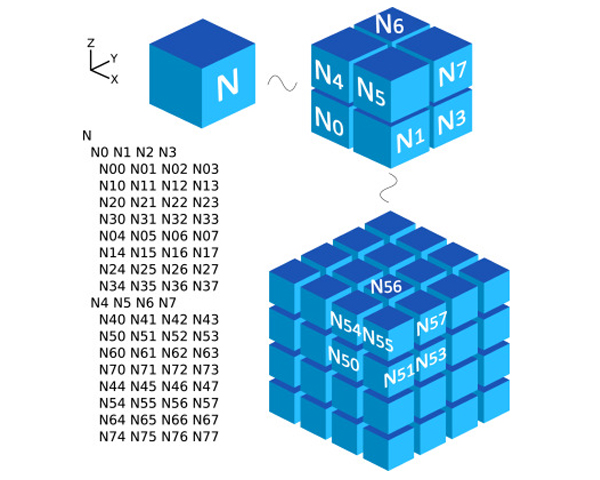
Slicing a model (computing thin slices of a geometric or volumetric model with a sweeping plane) is necessary for several applications ranging from 3D printing to medical imaging. This paper introduces a technique designed to compute these slices efficiently, even for huge and complex models. We voxelize the volume of the model at a required resolution and show how to encode this voxelization in an out-of-core octree using a novel Sweep Encoding linearization. This approach allows for efficient slicing with bounded cost per slice. We discuss specific applications, including 3D printing, and compare these octrees’ performance against the standard representations in the literature.
Computers and Graphics, Vol. 109, pp 30--41, 2022.
DOI: http://dx.doi.org/10.1016/j.cag.2022.09.009
DOI: http://dx.doi.org/10.1016/j.cag.2022.09.009
BibTeX
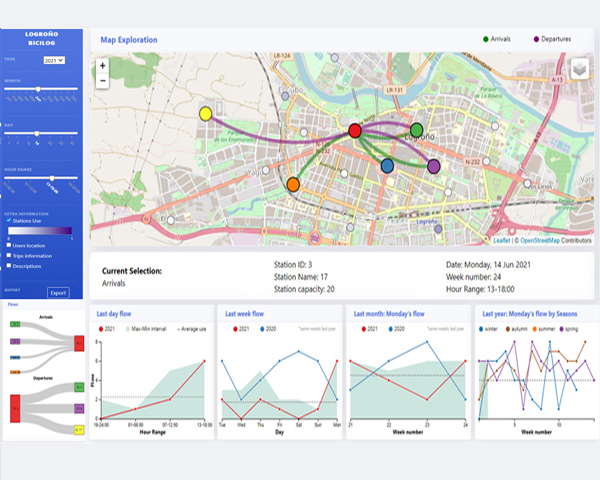
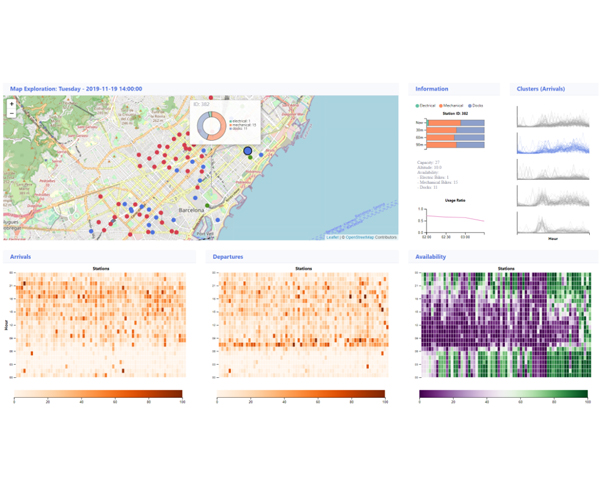
The last two decades have exhibited a profound transformation of traditional urban mobility patterns partly due to the exponential growth in both number and popularity of public bicycle sharing systems (BSS). Analysis and visualization of the data generated by BSSs have become of special interest to municipalities to evaluate the effect of their mobility programs and offer integrated urban mobility solutions. In this paper, we present a visualization system that aims to assist city officials from small and medium cities in their decision-making process with an intuitive representation of BSS data. It has been developed, tested, and evaluated together with officials and domain experts from the city of Logroño (Spain). Our tool presents usage information with different time granularities (yearly, monthly, weekly, or seasonally), shows traffic flows between stations, and provides an in-depth breakdown of users data such as their registered address, traveled distance, or gender-based patterns.
The comparison of documents—such as articles or patents search, bibliography recom-
mendations systems, visualization of document collections, etc.—has a wide range of applications
in several fields. One of the key tasks that such problems have in common is the evaluation of a
similarity metric. Many such metrics have been proposed in the literature. Lately, deep learning
techniques have gained a lot of popularity. However, it is difficult to analyze how those metrics
perform against each other. In this paper, we present a systematic empirical evaluation of several
of the most popular similarity metrics when applied to research articles. We analyze the results of
those metrics in two ways, with a synthetic test that uses scientific papers and Ph.D. theses, and in a
real-world scenario where we evaluate their ability to cluster papers from different areas of research.
View quality measures compute scores for given views and are used to determine an optimal view in viewpoint selection tasks.Unfortunately, despite the wide adoption of these measures, they are rather based on computational quantities, such as entropy,than human preferences. To instead tailor viewpoint measures towards humans, view quality measures need to be able to capturehuman viewpoint preferences. Therefore, we introduce a large-scale crowdsourced data set, which contains 58kannotated view-points for 3220 ModelNet40 models. Based on this data, we derive a neural view quality measure abiding to human preferences.We further demonstrate that this view quality measure not only generalizes to models unseen during training, but also to unseenmodel categories. We are thus able to predict view qualities for single images, and directly predict human preferred viewpointsfor 3D models by exploiting point-based learning technology, without requiring to generate intermediate images or samplingthe view sphere. We will detail our data collection procedure, describe the data analysis and model training and will evaluatethe predictive quality of our trained viewpoint measure on unseen models and categories. To our knowledge, this is the first deeplearning approach to predict a view quality measure solely based on human preferences.
IEEE Transactions on Affective Computing, Vol. 13, Num. 1, pp 75-95, 2022.
DOI: http://dx.doi.org/10.1109/TAFFC.2019.2930058
DOI: http://dx.doi.org/10.1109/TAFFC.2019.2930058
BibTeX
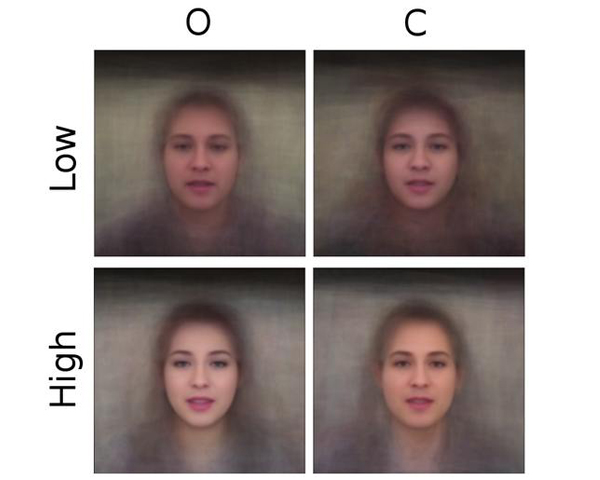
Personality analysis has been widely studied in psychology, neuropsychology, and signal processing fields, among others. From the past few years, it also became an attractive research area in visual computing. From the computational point of view, by far speech and text have been the most considered cues of information for analyzing personality. However, recently there has been an increasing interest from the computer vision community in analyzing personality from visual data. Recent computer vision approaches are able to accurately analyze human faces, body postures and behaviors, and use these information to infer apparent personality traits. Because of the overwhelming research interest in this topic, and of the potential impact that this sort of methods could have in society, we present in this paper an up-to-date review of existing vision-based approaches for apparent personality trait recognition. We describe seminal and cutting edge works on the subject, discussing and comparing their distinctive features and limitations. Future venues of research in the field are identified and discussed. Furthermore, aspects on the subjectivity in data labeling/evaluation, as well as current datasets and challenges organized to push the research on the field are reviewed.
4th IEEE VIS Workshop on Visualization Guidelines, 2022.
DOI: http://dx.doi.org/10.1109/VisGuides57787.2022.00006
DOI: http://dx.doi.org/10.1109/VisGuides57787.2022.00006
BibTeX
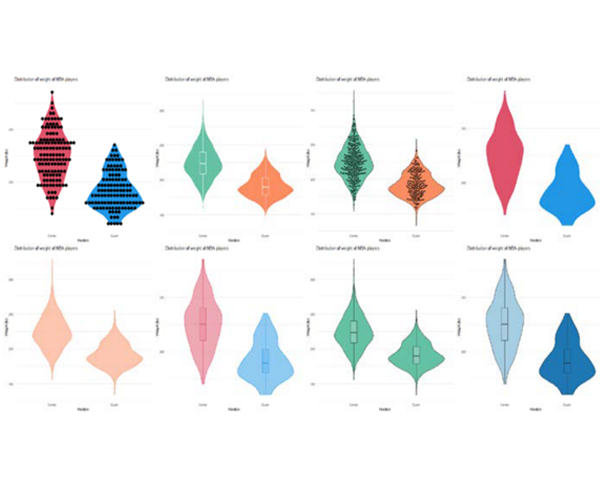
One way to illustrate distributions of samples is through the use of violin plots. The original design is a combination of boxplot and density plot mirrored and plot around the boxplot. However, there are other designs in literature. Although they seem a powerful way to illustrate distributions, the fact that they encode distributions makes them difficult to read. Users have problems comparing two different distributions, and certain basic statistics such as the mean can be difficult to estimate properly. To get more insights on how people interprets violin plots, we have carried out an experiment to analyze how the different configurations affect judgments over values encoded in those plots.
Smart Tools and Applications in Graphics (STAG) 2022, EuroGraphics Digital Library, 2022.
DOI: http://dx.doi.org/10.2312/evp.20221121
DOI: http://dx.doi.org/10.2312/evp.20221121
BibTeX
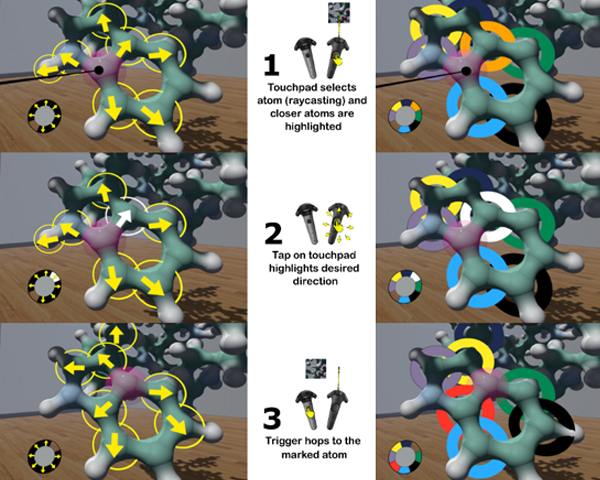
Accurate selection in cluttered scenes is complex because a high amount of precision is required. In Virtual Reality Environments, it is even worse, because it is more difficult for us to point a small object with our arms in the air. Not only our arms move slightly, but the button/trigger press reduces our weak stability. In this paper, we present two alternatives to the classical ray pointing intended to facilitate the selection of atoms in molecular environments. We have implemented and analyzed such techniques through an informal user study and found that they were highly appreciated by the users. This selection method could be interesting in other crowded environments beyond molecular visualization.
Computers & Graphics, Vol. 106, pp 174-186, 2022.
DOI: http://dx.doi.org/10.1016/j.cag.2022.06.003
DOI: http://dx.doi.org/10.1016/j.cag.2022.06.003
BibTeX
High-end Terrestrial Lidar Scanners are often equipped with RGB cameras that are used to colorize the point samples. Some of these scanners produce panoramic HDR images by encompassing the information of multiple pictures with different exposures. Unfortunately, exported RGB color values are not in an absolute color space, and thus point samples with similar reflectivity values might exhibit strong color differences depending on the scan the sample comes from. These color differences produce severe visual artifacts if, as usual, multiple point clouds colorized independently are combined into a single point cloud. In this paper we propose an automatic algorithm to minimize color differences among a collection of registered scans. The basic idea is to find correspondences between pairs of scans, i.e. surface patches that have been captured by both scans. If the patches meet certain requirements, their colors should match in both scans. We build a graph from such pair-wise correspondences, and solve for the gain compensation factors that better uniformize color across scans. The resulting panoramas can be used to colorize the point clouds consistently. We discuss the characterization of good candidate matches, and how to find such correspondences directly on the panorama images instead of in 3D space. We have tested this approach to uniformize color across scans acquired with a Leica RTC360 scanner, with very good results.

Computers & Graphics, Vol. 102, pp 164--174, 2022.
DOI: http://dx.doi.org/10.1016/j.cag.2021.08.020
DOI: http://dx.doi.org/10.1016/j.cag.2021.08.020
BibTeX
Path finding for autonomous agents has been traditionally driven by finding optimal paths, typically by using A* search or any of its variants. When it comes to simulating virtual humanoids, traditional approaches rarely consider aspects of human memory or orientation. In this work, we propose a new path finding algorithm, inspired by current research regarding how the brain learns and builds cognitive maps. Our method represents the space as a hexagonal grid with counters, based on brain research that has investigated how memory cells are fired. Our path finder then combines a method for exploring unknown environments while building such a cognitive map, with an A* search using a modified heuristic that takes into account the cognitive map. The resulting paths show how as the agent learns the environment, the paths become shorter and more consistent with the optimal A* search. Moreover, we run a perceptual study to demonstrate that the viewers could successfully identify the intended level of knowledge of the simulated agents. This line of research could enhance the believability of autonomous agents’ path finding in video games and other VR applications.
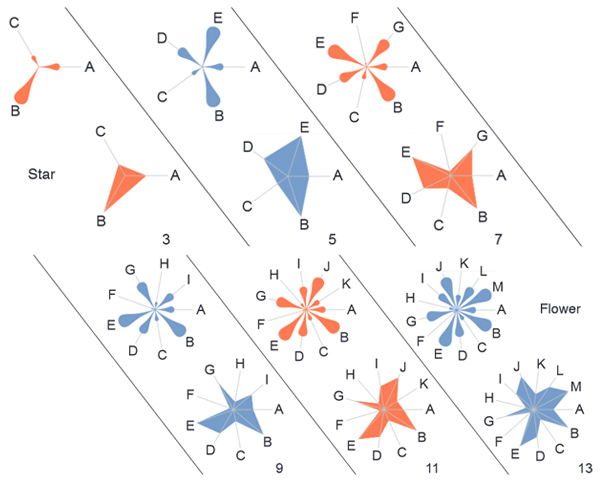
Exploring high-dimensional data is a common task in many scientific disciplines. To address this task, two-dimensional embeddings, such as tSNE and UMAP, are widely used. While these determine the 2D position of data items, effectively encoding the first two dimensions, suitable visual encodings can be employed to communicate higher-dimensional features. To investigate such encodings, we have evaluated two commonly used glyph types, namely flower glyphs and star glyphs. To evaluate their capabilities for communicating higher-dimensional features in two-dimensional embeddings, we ran a large set of crowd-sourced user studies using real-world data obtained from data.gov. During these studies, participants completed a broad set of relevant tasks derived from related research. This paper describes the evaluated glyph designs, details our tasks, and the quantitative study setup before discussing the results. Finally, we will present insights and provide guidance on the choice of glyph encodings when exploring high-dimensional data.
Special Issue EuroVis, Vol. 4, Num. 3, pp 531--542, 2021.
DOI: http://dx.doi.org/10.1111/cgf.14327
DOI: http://dx.doi.org/10.1111/cgf.14327
BibTeX
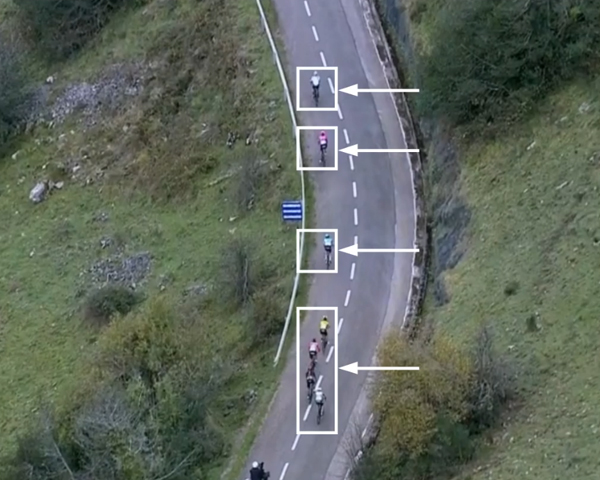
There are many multiple-stage racing competitions in various sports such as swimming, running, or cycling. The wide availability of affordable tracking devices facilitates monitoring the position along with the race of all participants, even for non-professional contests. Getting real-time information of contenders is useful but also unleashes the possibility of creating more complex visualization systems that ease the understanding of the behavior of all participants during a simple stage or throughout the whole competition. In this paper we focus on bicycle races, which are highly popular, especially in Europe, being the Tour de France its greatest exponent. Current visualizations from TV broadcasting or real-time tracking websites are useful to understand the current stage status, up to a certain extent. Unfortunately, still no current system exists that visualizes a whole multi-stage contest in such a way that users can interactively explore the relevant events of a single stage (e.g. breakaways, groups, virtual leadership…), as well as the full competition. In this paper, we present an interactive system that is useful both for aficionados and professionals to visually analyze the development of multi-stage cycling competitions.
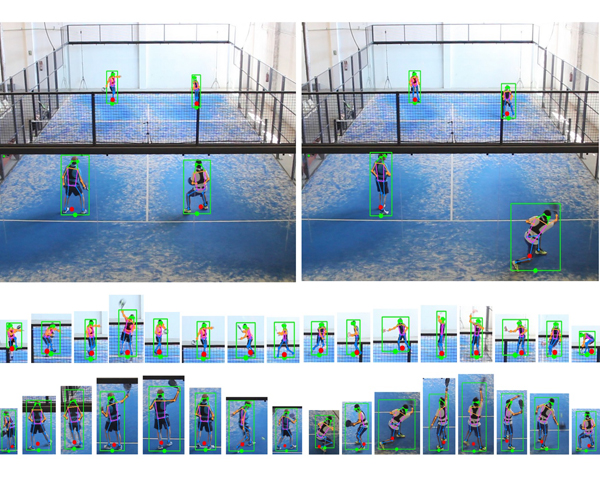
The estimation of player positions is key for performance analysis in sport. In this paper, we focus on image-based, single-angle, player position estimation in padel. Unlike tennis, the primary camera view in professional padel videos follows a de facto standard, consisting of a high-angle shot at about 7.6 m above the court floor. This camera angle reduces the occlusion impact of the mesh that stands over the glass walls, and offers a convenient view for judging the depth of the ball and the player positions and poses. We evaluate and compare the accuracy of state-of-the-art computer vision methods on a large set of images from both amateur videos and publicly available videos from the major international padel circuit. The methods we analyze include object detection, image segmentation and pose estimation techniques, all of them based on deep convolutional neural networks. We report accuracy and average precision with respect to manually-annotated video frames. The best results are obtained by top-down pose estimation methods, which offer a detection rate of 99.8% and a RMSE below 5 and 12 cm for horizontal/vertical court-space coordinates (deviations from predicted and ground-truth player positions). These results demonstrate the suitability of pose estimation methods based on deep convolutional neural networks for estimating player positions from single-angle padel videos. Immediate applications of this work include the player and team analysis of the large collection of publicly available videos from international circuits, as well as an inexpensive method to get player positional data in amateur padel clubs.
Computers & Graphics, Vol. 99, pp 83--99, 2021.
DOI: http://dx.doi.org/10.1016/j.cag.2021.06.014
DOI: http://dx.doi.org/10.1016/j.cag.2021.06.014
BibTeX
Authoring meaningful crowds to populate a virtual city can be a cumbersome, time-consuming and an error-prone task. In this work, we present a new framework for authoring populated environments in an easier and faster way, by relying on the use of procedural techniques. Our framework consists of the procedural generation of semantically-augmented virtual cities to drive the procedural generation and simulation of crowds. The main novelty lies in the generation of agendas for each individual inhabitant (alone or as part of a family) by using a rule-based grammar that combines city semantics with the autonomous persons’ characteristics. A new population or city can be authored by editing rule files with the flexibility of reusing, combining or extending the rules of previous populations. The results show how logical and consistent sequences of whereabouts can be easily generated for a crowd providing a good starting point to bring virtual cities to life.
Computer Graphics Forum, Vol. 40, Num. 6, pp 394--408, 2021.
DOI: http://dx.doi.org/10.1111/cgf.14386
DOI: http://dx.doi.org/10.1111/cgf.14386
BibTeX
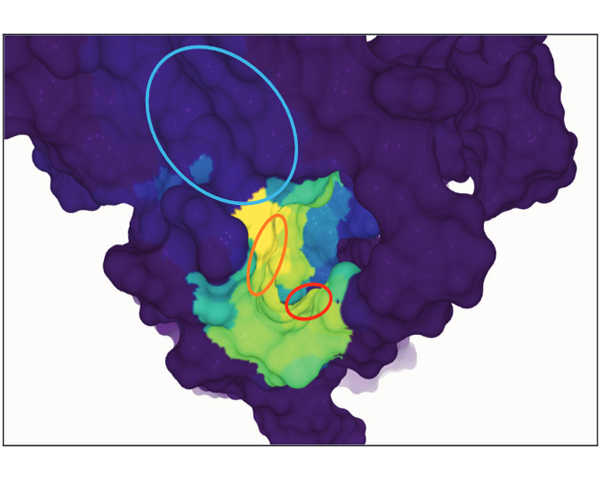
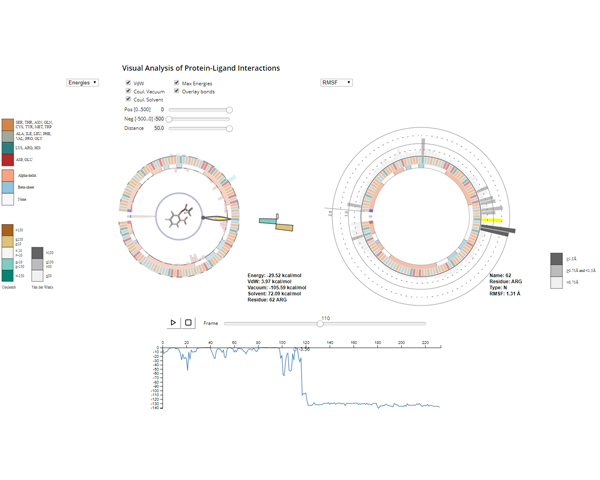
When studying protein-ligand interactions, many different factors can influence the behaviour of the protein as well as theligands. Molecular visualisation tools typically concentrate on the movement of single ligand molecules; however, viewing onlyone molecule can merely provide a hint of the overall behaviour of the system. To tackle this issue, we do not focus on thevisualisationofthelocalactionsofindividualligandmoleculesbutontheinfluenceofaproteinandtheiroverallmovement.Sincethe simulations required to study these problems can have millions of time steps, our presented system decouples visualisationand data preprocessing: our preprocessing pipeline aggregates the movement of ligand molecules relative to a receptor protein.For data analysis, we present a web-based visualisation application that combines multiple linked 2D and 3D views that displaythe previously calculated data The central view, a novel enhanced sequence diagram that shows the calculated values, is linkedto a traditional surface visualisation of the protein. This results in an interactive visualisation that is independent of the size ofthe underlying data, since the memory footprint of the aggregated data for visualisation is constant and very low, even if the rawinput consisted of several terabytes.
Computer Graphics Forum (Proc. EuroGraphics, 2021), Vol. 40, Num. 2, pp 413--423, 2021.
DOI: http://dx.doi.org/10.1111/cgf.142643
DOI: http://dx.doi.org/10.1111/cgf.142643
BibTeX
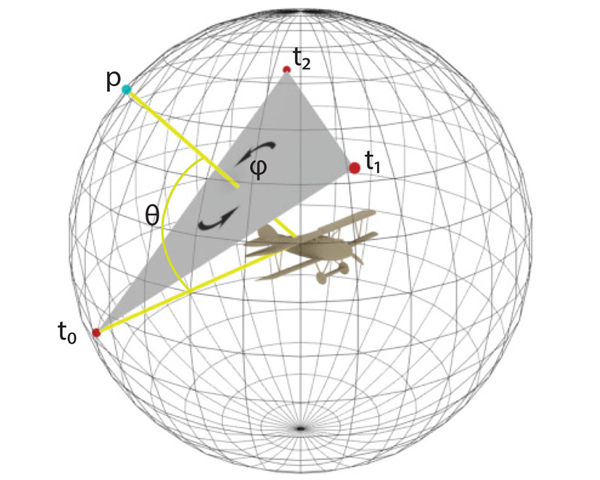
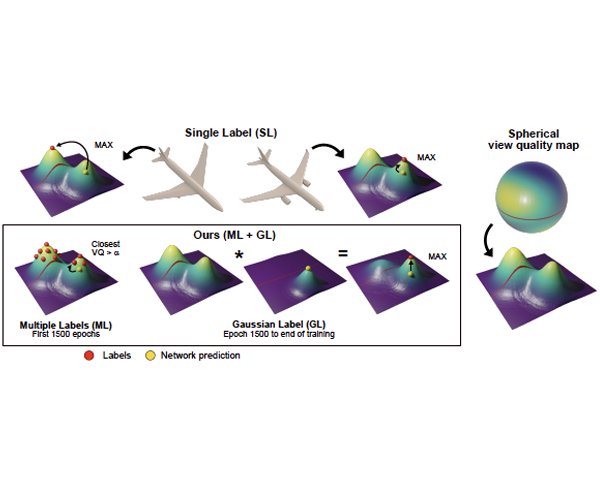
Optimal viewpoint prediction is an essential task in many computer graphics applications. Unfortunately, common viewpoint qualities suffer from two major drawbacks: dependency on clean surface meshes, which are not always available, and the lack of closed-form expressions, which requires a costly search involving rendering. To overcome these limitations we propose to separate viewpoint selection from rendering through an end-to-end learning approach, whereby we reduce the influence of the mesh quality by predicting viewpoints from unstructured point clouds instead of polygonal meshes. While this makes our approach insensitive to the mesh discretization during evaluation, it only becomes possible when resolving label ambiguities that arise in this context. Therefore, we additionally propose to incorporate the label generation into the training procedure, making the label decision adaptive to the current network predictions. We show how our proposed approach allows for learning viewpoint predictions for models from different object categories and for different viewpoint qualities. Additionally, we show that prediction times are reduced from several minutes to a fraction of a second, as compared to state-of-the-art (SOTA) viewpoint quality evaluation. We will further release the code and training data, which will to our knowledge be the biggest viewpoint quality dataset available.
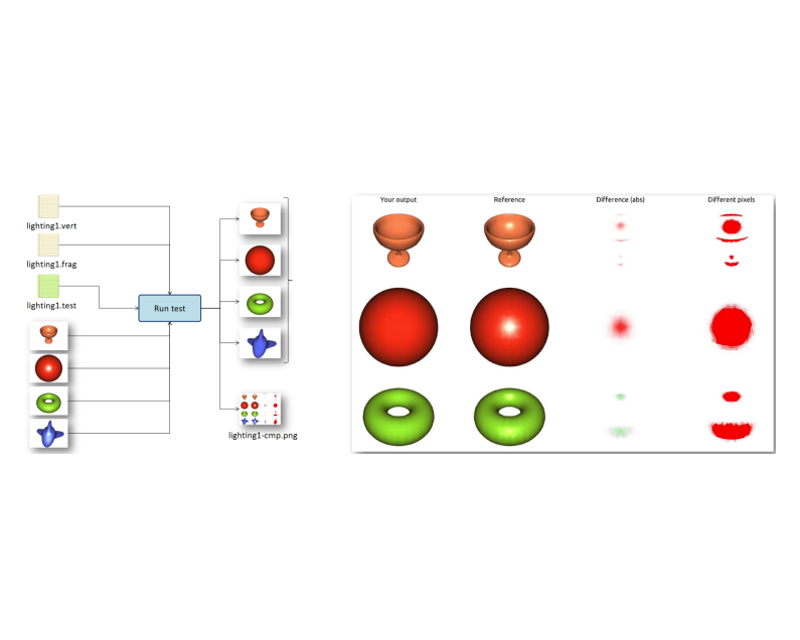
IEEE computer graphics and applications, Vol. 40, Num. 3, pp 105--111, 2020.
DOI: http://dx.doi.org/10.1109/MCG.2020.2981786
DOI: http://dx.doi.org/10.1109/MCG.2020.2981786
BibTeX
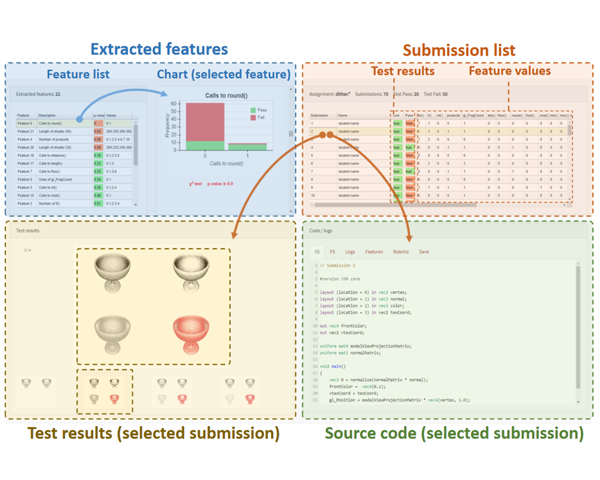
Modern computer graphics courses require students to complete assignments involving computer programming. The evaluation of student programs, either by the student (self-assessment) or by the instructors (grading) can take a considerable amount of time and does not scale well with large groups. Interactive judges giving a pass/fail verdict do constitute a scalable solution, but they only provide feedback on output correctness. In this article, we present a tool to provide extensive feedback on student submissions. The feedback is based both on checking the output against test sets, as well as on syntactic and semantic analysis of the code. These analyses are performed through a set of code features and instructor-defined rubrics. The tool is built with Python and supports shader programs written in GLSL. Our experiments demonstrate that the tool provides extensive feedback that can be useful to support self-assessment, facilitate grading, and identify frequent programming mistakes.
Computer Graphics Forum, Vol. 39, Num. 1, pp 174--184, 2020.
DOI: http://dx.doi.org/10.1111/cgf.13752
DOI: http://dx.doi.org/10.1111/cgf.13752
BibTeX
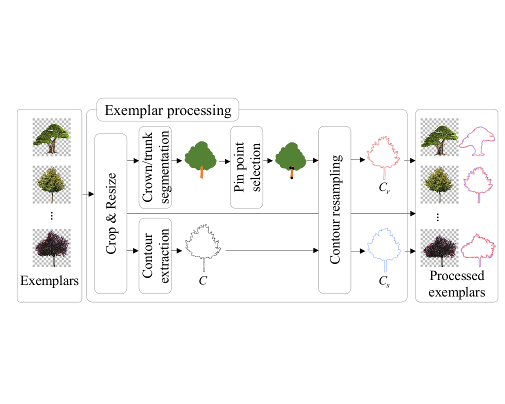
The automatic generation of realistic vegetation closely reproducing the appearance of specific plant species is still a challenging topic in computer graphics. In this paper, we present a new approach to generate new tree models from a small collection of frontal RGBA images of trees. The new models are represented either as single billboards (suitable for still image generation in areas such as architecture rendering) or as billboard clouds (providing parallax effects in interactive applications). Key ingredients of our method include the synthesis of new contours through convex combinations of exemplar countours, the automatic segmentation into crown/trunk classes and the transfer of RGBA colour from the exemplar images to the synthetic target. We also describe a fully automatic approach to convert a single tree image into a billboard cloud by extracting superpixels and distributing them inside a silhouette defined 3D volume. Our algorithm allows for the automatic generation of an arbitrary number of tree variations from minimal input, and thus provides a fast solution to add vegetation variety in outdoor scenes.
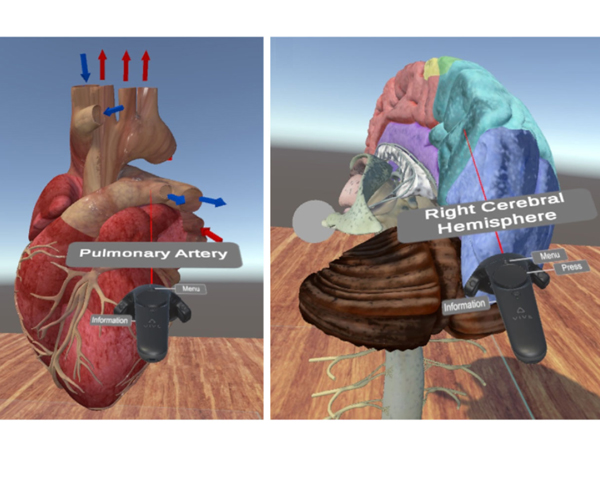
VR4Health: Personalized teaching and learning anatomy using VR
Journal of Medical Systems, Vol. 44, Num. 5, pp 1--13, 2020.
DOI: http://dx.doi.org/10.1007/s10916-020-01550-5
DOI: http://dx.doi.org/10.1007/s10916-020-01550-5
BibTeX
Virtual Reality (VR) is being integrated into many different areas of our lives, from industrial engineering to video-games, and also including teaching and education. We have several examples where VR has been used to engage students and facilitate their 3D spatial understanding, but can VR help also teachers? What are the benefits teachers can obtain on using VR applications? In this paper we present an application (VR4Health) designed to allow students to directly inspect 3D models of several human organs by using Virtual Reality systems. The application is designed to be used in an HMD device autonomously as a self-learning tool and also reports information to teachers in order that he/she becomes aware of what the students do and can redirect his/her work to the concrete necessities of the student. We evaluate both the students and the teachers perception by doing an experiment and asking them to fill-in a questionnaire at the end of the experiment.
Frontiers in Virtual Reality, Vol. 1, pp 20, 2020.
DOI: http://dx.doi.org/10.3389/frvir.2020.561558
DOI: http://dx.doi.org/10.3389/frvir.2020.561558
BibTeX
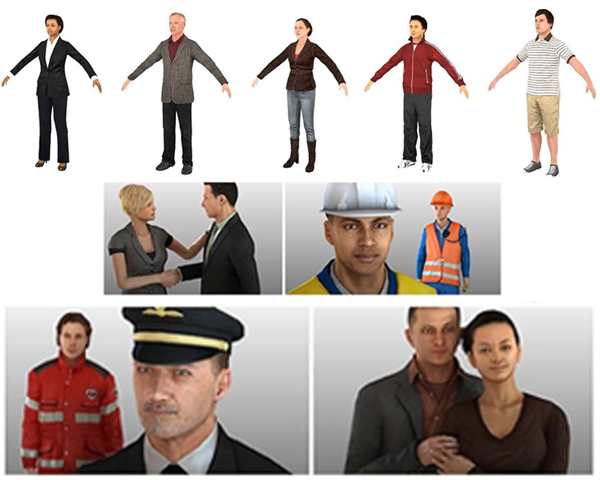
As part of the open sourcing of the Microsoft Rocketbox avatar library for research and academic purposes, here we discuss the importance of rigged avatars for the Virtual and Augmented Reality (VR, AR) research community. Avatars, virtual representations of humans, are widely used in VR applications. Furthermore many research areas ranging from crowd simulation to neuroscience, psychology, or sociology have used avatars to investigate new theories or to demonstrate how they influence human performance and interactions. We divide this paper in two main parts: the first one gives an overview of the different methods available to create and animate avatars. We cover the current main alternatives for face and body animation as well introduce upcoming capture methods. The second part presents the scientific evidence of the utility of using rigged avatars for embodiment but also for applications such as crowd simulation and entertainment. All in all this paper attempts to convey why rigged avatars will be key to the future of VR and its wide adoption.
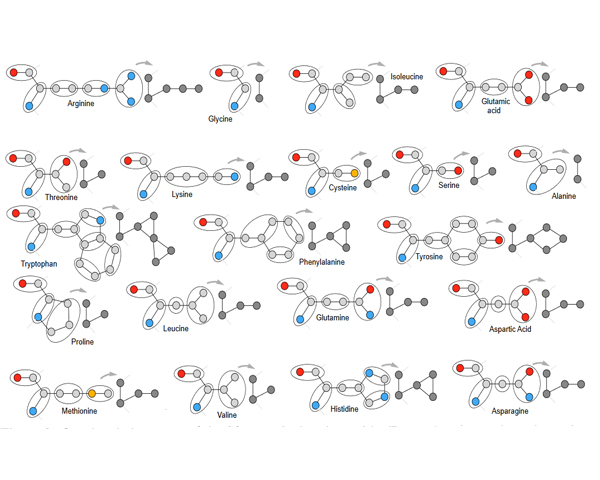
Proteins perform a large variety of functions in living organisms, thus playing a key role in biology. As of now, available learning algorithms to process protein data do not consider several particularities of such data and/or do not scale well for large protein conformations. To fill this gap, we propose two new learning operations enabling deep 3D analysis of large-scale protein data. First, we introduce a novel convolution operator which considers both, the intrinsic (invariant under protein folding) as well as extrinsic (invariant under bonding) structure, by using n-D convolutions defined on both the Euclidean distance, as well as multiple geodesic distances between atoms in a multi-graph. Second, we enable a multi-scale protein analysis by introducing hierarchical pooling operators, exploiting the fact that proteins are a recombination of a finite set of amino acids, which can be pooled using shared pooling matrices. Lastly, we evaluate the accuracy of our algorithms on several large-scale data sets for common protein analysis tasks, where we outperform state-of-the-art methods.
Computers & graphics , Vol. 91, pp 39--51, 2020.
DOI: http://dx.doi.org/10.1016/j.cag.2020.06.005
DOI: http://dx.doi.org/10.1016/j.cag.2020.06.005
BibTeX
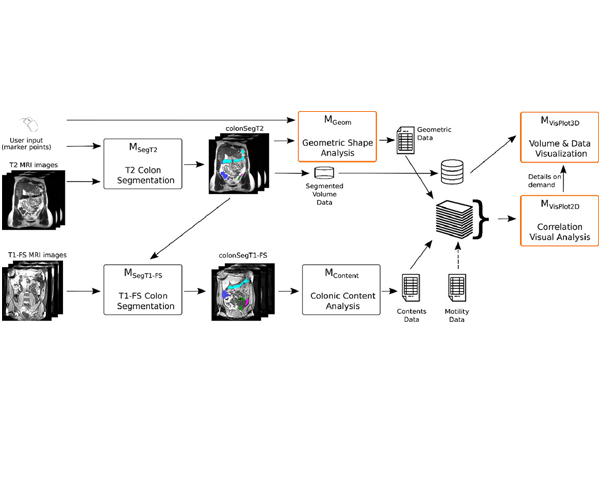
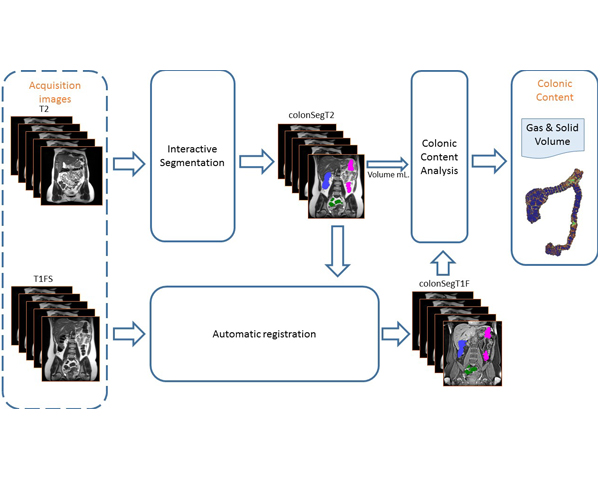
Computerized Tomography (CT) and, more recently, Magnetic Resonance Imaging (MRI) have become the state-of-the art techniques for morpho-volumetric analysis of abdominal cavities. Due to its constant motility, the colon is an organ difficult to analyze. Unfortunately, CTs radiative nature makes it only indicated for patients with important disorders. Lately, acquisition techniques that rely on the use of MRI have matured enough to enable the analysis of colon data. This allows gathering data of patients with- out preparation (i.e. administration of drugs or contrast agents), and incorporating data of patients with non life-threatening diseases and healthy subjects to databases. In this paper we present an end-to-end framework that comprises all the steps to extract colon content and morphology data coupled with a web-based visualization tool that facilitates the visual exploration of such data. We also introduce the set of tools for the extraction of morphological data, and a detailed description of a specifically-designed interactive tool that facilitates a visual comparison of numerical variables within a set of patients, as well as a detailed inspection of an individual. Our prototype was evaluated by domain experts, which showed that our visual approach may reduce the costly process of colon data analysis. As a result, physicians have been able to get new insights on the effects of diets, and also to obtain a better understanding on the motility of the colon.
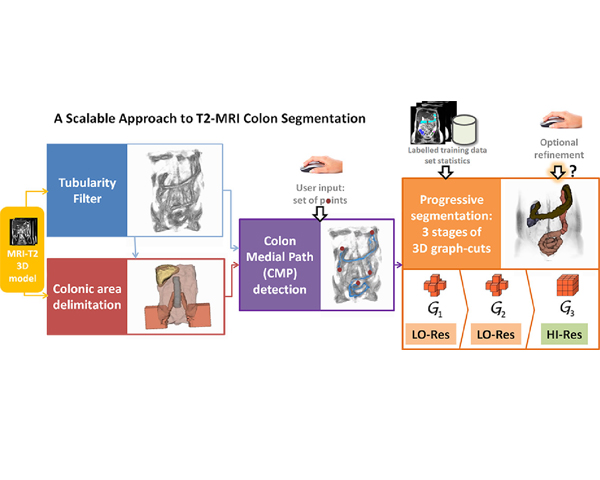
The study of the colonic volume is a procedure with strong relevance to gastroenterologists. Depending on the clinical protocols, the volume analysis has to be performed on MRI of the unprepared colon without contrast administration. In such circumstances, existing measurement procedures are cumbersome and time-consuming for the specialists. The algorithm presented in this paper permits a quasi-automatic segmentation of the unprepared colon on T2-weighted MRI scans.
The segmentation algorithm is organized as a three-stage pipeline. In the first stage, a custom tubularity filter is run to detect colon candidate areas. The specialists provide a list of points along the colon trajectory, which are combined with tubularity information to calculate an estimation of the colon medial path. In the second stage, we delimit the region of interest by applying custom segmentation algorithms to detect colon neighboring regions and the fat capsule containing abdominal organs. Finally, within the reduced search space, segmentation is performed via 3D graph-cuts in a three-stage multigrid approach.
Our algorithm was tested on MRI abdominal scans, including different acquisition resolutions, and its results were compared to the colon ground truth segmentations provided by the specialists. The experiments proved the accuracy, efficiency, and usability of the algorithm, while the variability of the scan resolutions contributed to demonstrate the computational scalability of the multigrid architecture. The system is fully applicable to the colon measurement clinical routine, being a substantial step towards a fully automated segmentation.
Computers & Graphics, Vol. 86, pp 1--14, 2020.
DOI: http://dx.doi.org/10.1016/j.cag.2019.10.006
DOI: http://dx.doi.org/10.1016/j.cag.2019.10.006
BibTeX
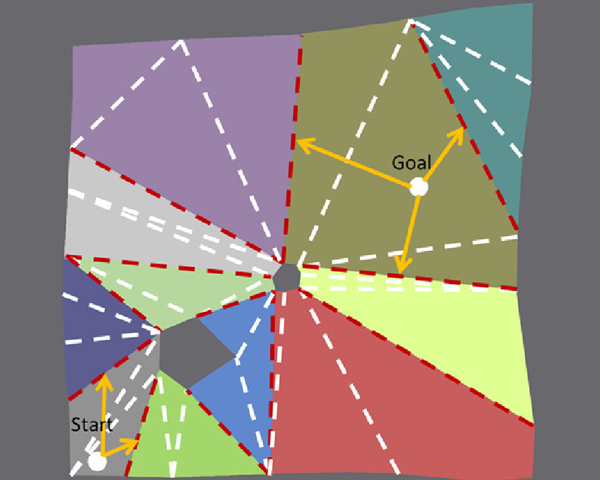
One of the main challenges in video games is to compute paths as efficiently as possible for groups of agents. As both the size of the environments and the number of autonomous agents increase, it becomes harder to obtain results in real time under the constraints of memory and computing resources. Hierarchical approaches, such as HNA* (Hierarchical A* for Navigation Meshes) can compute paths more efficiently, although only for certain configurations of the hierarchy. For other configurations, the method suffers from a bottleneck in the step that connects the Start and Goal positions with the hierarchy. This bottleneck can drop performance drastically. In this paper we present two approaches to solve the HNA* bottleneck and thus obtain a performance boost for all hierarchical configurations. The first method relies on further memory storage, and the second one uses parallelism on the GPU. Our comparative evaluation shows that both approaches offer speed-ups as high as 9x faster than A*, and show no limitations based on hierarchical configuration. Finally we show how our CUDA based parallel implementation of HNA* for multi-agent path finding can now compute paths for over 500K agents simultaneously in real-time, with speed-ups above 15x faster than a parallel multi-agent implementation using A*.
Computers & Graphics, Vol. 94, pp 5--6, 2020.
DOI: http://dx.doi.org/10.1016/j.cag.2020.11.004
DOI: http://dx.doi.org/10.1016/j.cag.2020.11.004
BibTeX
SIBGRAPI-Conference on Graphics, Patterns and Images is an international conference annually promoted by the Brazilian Computer Society (SBC). SIBGRAPI is one of the most traditional and important Brazilian scientific events in Computer Science. It is attended by researchers, artists, designers, and students from Colleges, Universities, Companies and Research Centers, gathering around 200 participants from different regions of Brazil and abroad. SIBGRAPI is the main conference of the Special Committee of Computer Graphics and Image Processing of SBC (Brazilian Computer Society) and held in cooperation with ACM SIGGRAPH.
The proceedings of the event have been published by CPS since 1997, and all the editions are available from IEEE Xplore Digital Library. In addition, SIBGRAPI 2020 has Special Sections of the Elsevier Computers and Graphics, IEEE Geoscience and Remote Sensing Letters and Pattern Recognition Letters journals. We are really happy that Alan Bovik (UT Austin, USA), Catherine Pelachaud (CNRS-ISIR, Sorbonne University, France), James Gain (UCT, South Africa), Helio Lopes (PUC-Rio, Brazil) and Olga Bellon (UFPR, Brazil) each gave a keynote at SIBGRAPI 2020.
This year we accepted papers previously submitted to the Special Track on SIBGRAPI for the Elsevier CG journal. We received 31 high-standard papers and only the ten best papers have made it to publication in this special issue. They were selected by a committee of well-renowned researchers in the field in two revision phases, where each paper has been reviewed by at least three reviewers at each phase. We thank all reviewers for their amazing and high-quality work. Selected papers were focused on Global illumination and Scientific Visualization, Point-based rendering, Visual Analytics and Explainable AI, Deep learning and Scene understanding, Computer animation and Convolutional adversarial network to generate dance motion, Spherical images and Realistic rendering. The remaining papers have been encouraged to submission to the main track at SIBGRAPI conference.
Virtual Reality, Num. 24, pp 683--694, 2020.
DOI: http://dx.doi.org/10.1007/s10055-020-00428-8
DOI: http://dx.doi.org/10.1007/s10055-020-00428-8
BibTeX
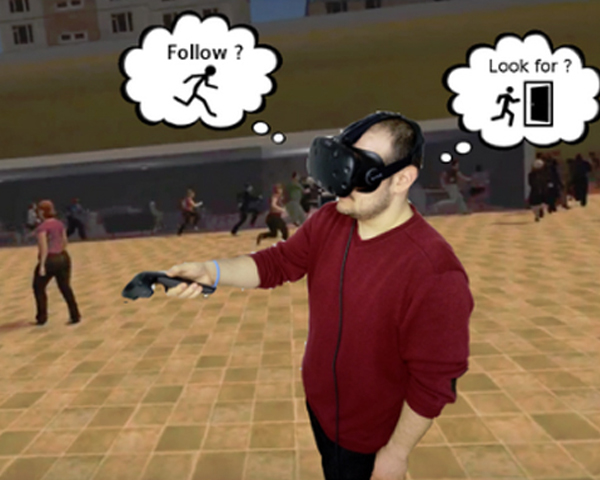
Understanding human decision making is a key requirement to improve crowd simulation models so that they can better mimic real human behavior. It is often difficult to study human decision making during dangerous situations because of the complexity of the scenarios and situations to be simulated. Immersive virtual reality offers the possibility to carry out such experiments without exposing participants to real danger. In the real world, it has often been observed that people tend to follow others in certain situations (e.g., unfamiliar environments or stressful situations). In this paper, we study human following behavior when it comes to exit choice during an evacuation of a train station. We have carried out immersive VR experiments under different levels of stress (alarm only or alarm plus fire), and we have observed how humans consistently tend to follow the crowd regardless of the levels of stress. Our results show that decision making is strongly influenced by the behavior of the virtual crowd: the more virtual people running, the more likely are participants to simply follow others. The results of this work could improve behavior simulation models during crowd evacuation, and thus build more plausible scenarios for training firefighters.
IEEE access, Vol. 8, pp 122782--122790, 2020.
DOI: http://dx.doi.org/10.1109/ACCESS.2020.3006423
DOI: http://dx.doi.org/10.1109/ACCESS.2020.3006423
BibTeX
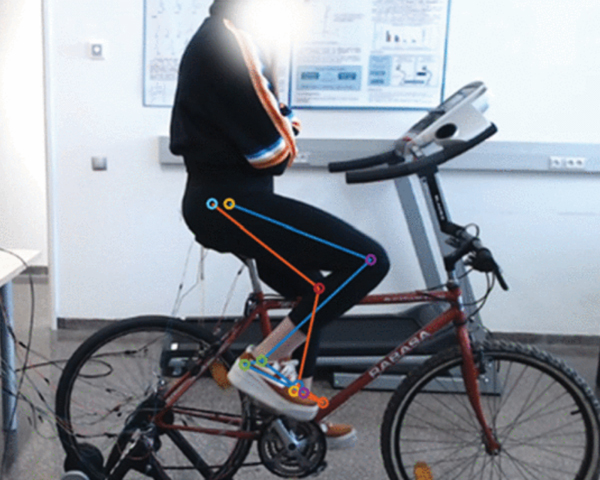
Marker-less systems are becoming popular to detect a human skeleton in an image automatically. However, these systems have difficulties in tracking points when part of the body is hidden, or there is an artifact that does not belong to the subject (e.g., a bicycle). We present a low-cost tracking system combined with economic force-measurement sensors that allows the calculation of individual joint moments and powers affordable for anybody. The system integrates OpenPose (deep-learning based C++ library to detect human skeletons in an image) in a system of two webcams, to record videos of a cyclist, and seven resistive sensors to measure forces at the pedals and the saddle. OpenPose identifies the skeleton candidate using a convolution neural network. A corrective algorithm was written to automatically detect the hip, knee, ankle, metatarsal and heel points from webcam-recorded motions, which overcomes the limitations of the marker-less system. Then, with the information of external forces, an inverse dynamics analysis is applied in OpenSim to calculate the joint moments and powers at the hip, knee, and ankle joints. The results show that the obtained moments have similar shapes and trends compared to the literature values. Therefore, this represents a low-cost method that could be used to estimate relevant joint kinematics and dynamics, and consequently follow up or improve cycling training plans.
NAR Genomics and Bioinformatics, Vol. 2, Num. 2, 2020.
DOI: http://dx.doi.org/10.1093/nargab/lqaa029
DOI: http://dx.doi.org/10.1093/nargab/lqaa029
BibTeX
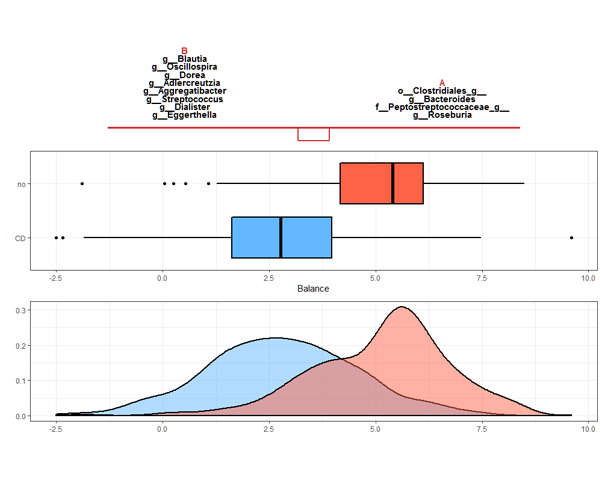
Though variable selection is one of the most relevant tasks in microbiome analysis, e.g. for the identification of microbial signatures, many studies still rely on methods that ignore the compositional nature of microbiome data. The applicability of compositional data analysis methods has been hampered by the availability of software and the difficulty in interpreting their results. This work is focused on three methods for variable selection that acknowledge the compositional structure of microbiome data: selbal, a forward selection approach for the identification of compositional balances, and clr-lasso and coda-lasso, two penalized regression models for compositional data analysis. This study highlights the link between these methods and brings out some limitations of the centered log-ratio transformation for variable selection. In particular, the fact that it is not subcompositionally consistent makes the microbial signatures obtained from clr-lasso not readily transferable. Coda-lasso is computationally efficient and suitable when the focus is the identification of the most associated microbial taxa. Selbal stands out when the goal is to obtain a parsimonious model with optimal prediction performance, but it is computationally greedy. We provide a reproducible vignette for the application of these methods that will enable researchers to fully leverage their potential in microbiome studies.
Computers & Graphics, Vol. 91, pp 52--82, 2020.
DOI: http://dx.doi.org/10.1016/j.cag.2020.06.006
DOI: http://dx.doi.org/10.1016/j.cag.2020.06.006
BibTeX
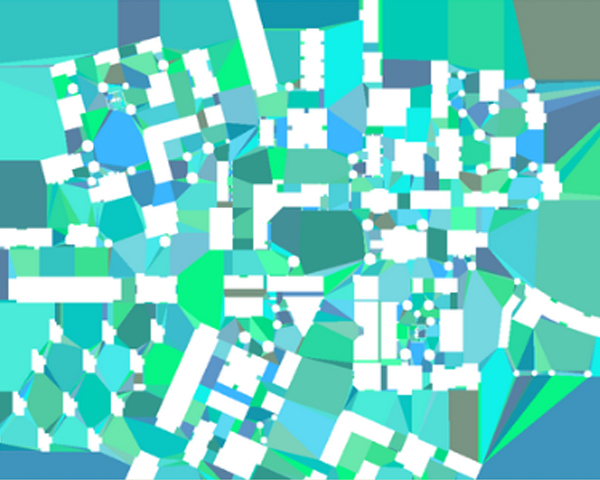
A navigation mesh is a representation of a 2D or 3D virtual environment that enables path planning and crowd simulation for walking characters. Various state-of-the-art navigation meshes exist, but there is no standardized way of evaluating or comparing them. Each implementation is in a different state of maturity, has been tested on different hardware, uses different example environments, and may have been designed with a different application in mind. In this paper, we develop and use a framework for comparing navigation meshes. First, we give general definitions of 2D and 3D environments and navigation meshes. Second, we propose theoretical properties by which navigation meshes can be classified. Third, we introduce metrics by which the quality of a navigation mesh implementation can be measured objectively. Fourth, we use these properties and metrics to compare various state-of-the-art navigation meshes in a range of 2D and 3D environments. Finally, we analyze our results to identify important topics for future research on navigation meshes. We expect that this work will set a new standard for the evaluation of navigation meshes, that it will help developers choose an appropriate navigation mesh for their application, and that it will steer future research in interesting directions.
Neurogastroenterology & Motility, Vol. 31, Num. 12, pp 1--7, 2019.
DOI: http://dx.doi.org/10.1111/nmo.13703
DOI: http://dx.doi.org/10.1111/nmo.13703
BibTeX
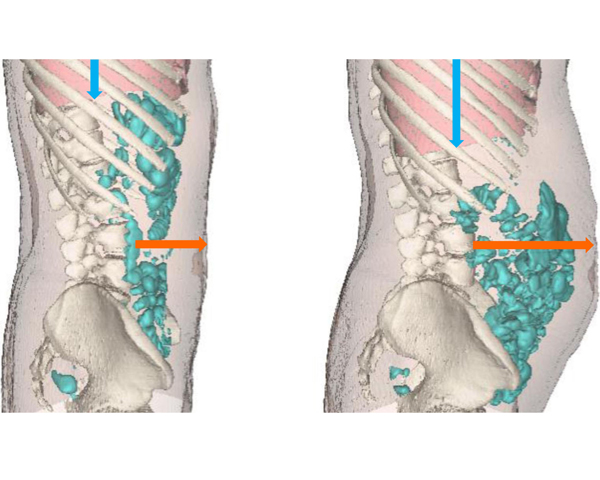
Some patients complain that eating lettuce, gives them gas and abdominal distention. Our aim was to determine to what extent the patients assertion is sustained by evidence. An in vitro study measured the amount of gas produced during the process of fermentation by a preparation of human colonic microbiota (n = 3) of predigested lettuce, as compared to beans, a high gas-releasing substrate, to meat, a low gas-releasing substrate, and to a nutrient-free negative control. A clinical study in patients complaining of abdominal distention after eating lettuce (n = 12) measured the amount of intestinal gas and the morphometric configuration of the abdominal cavity in abdominal CT scans during an episode of lettuce-induced distension as compared to basal conditions. Gas production by microbiota fermentation of lettuce in vitro was similar to that of meat (P = .44), lower than that of beans (by 78 ± 15%; P < .001) and higher than with the nutrient-free control (by 25 ± 19%; P = .05). Patients complaining of abdominal distension after eating lettuce exhibited an increase in girth (35 ± 3 mm larger than basal; P < .001) without significant increase in colonic gas content (39 ± 4 mL increase; P = .071); abdominal distension was related to a descent of the diaphragm (by 7 ± 3 mm; P = .027) with redistribution of normal abdominal contents. Lettuce is a low gas - releasing substrate for microbiota fermentation and lettuce - induced abdominal distension is produced by an uncoordinated activity of the abdominal walls. Correction of the somatic response might be more effective than the current dietary restriction strategy.
Visualization of Large Molecular Trajectories
Proc. IEEE Transactions on Visualization and Computer Graphics, Vol. 25, Num. 1, pp 987--996, 2019.
DOI: http://dx.doi.org/10.1109/TVCG.2018.2864851
PDF
DOI: http://dx.doi.org/10.1109/TVCG.2018.2864851
BibTeX
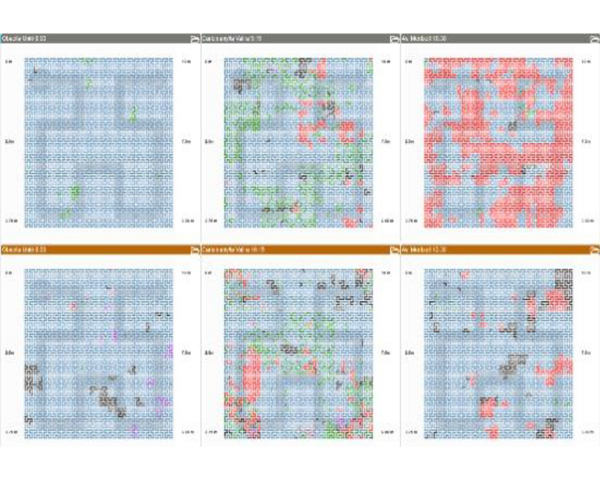
The analysis of protein-ligand interactions is a time-intensive task. Researchers have to analyze multiple physico-chemical
properties of the protein at once and combine them to derive conclusions about the protein-ligand interplay. Typically, several charts
are inspected, and 3D animations can be played side-by-side to obtain a deeper understanding of the data. With the advances in
simulation techniques, larger and larger datasets are available, with up to hundreds of thousands of steps. Unfortunately, such large
trajectories are very difficult to investigate with traditional approaches. Therefore, the need for special tools that facilitate inspection of
these large trajectories becomes substantial. In this paper, we present a novel system for visual exploration of very large trajectories in
an interactive and user-friendly way. Several visualization motifs are automatically derived from the data to give the user the information
about interactions between protein and ligand. Our system offers specialized widgets to ease and accelerate data inspection and
navigation to interesting parts of the simulation. The system is suitable also for simulations where multiple ligands are involved. We
have tested the usefulness of our tool on a set of datasets obtained from protein engineers, and we describe the expert feedback.
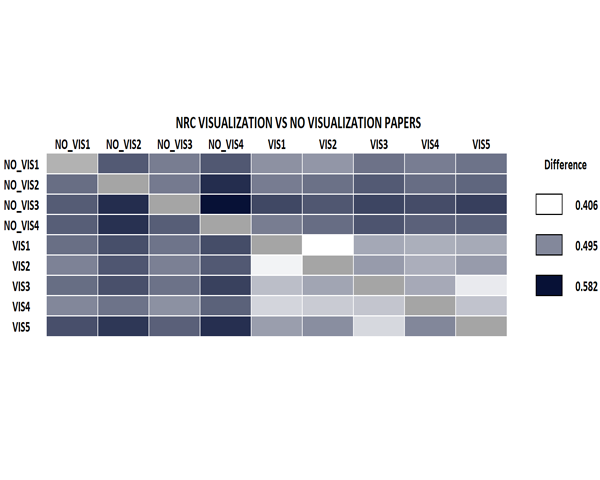
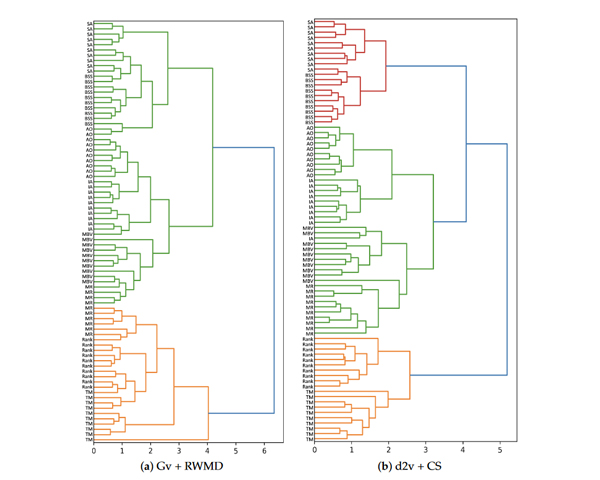
The analysis of research paper collections is an interesting topic that can give insights on whether a research area is stalled in the same problems, or there is a great amount of novelty every year. Previous research has addressed similar tasks by the analysis of keywords or reference lists, with different degrees of human intervention. In this paper, we demonstrate how, with the use of Normalized Relative Compression, together with a set of automated data-processing tasks, we can successfully visually compare research articles and document collections. We also achieve very similar results with Normalized Conditional Compression that can be applied with a regular compressor. With our approach, we can group papers of different disciplines, analyze how a conference evolves throughout the different editions, or how the profile of a researcher changes through the time. We provide a set of tests that validate our technique, and show that it behaves better for these tasks than other techniques previously proposed.
Computer Graphics Forum, Vol. 37, Num. 5, pp 233--243, 2018.
DOI: http://dx.doi.org/10.1111/cgf.13505
DOI: http://dx.doi.org/10.1111/cgf.13505
BibTeX
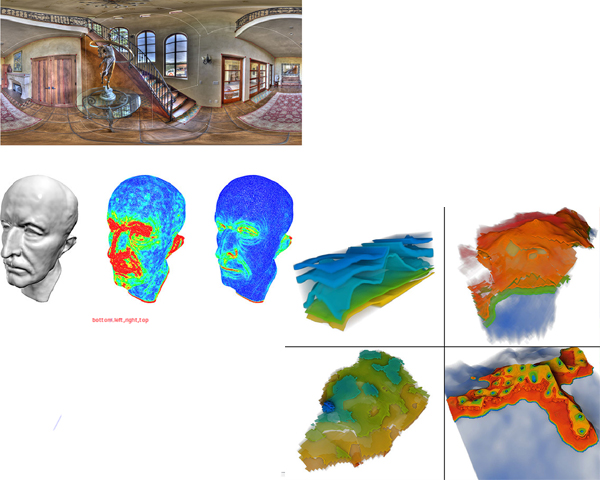
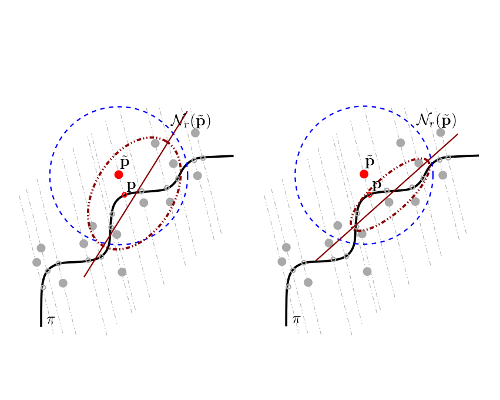
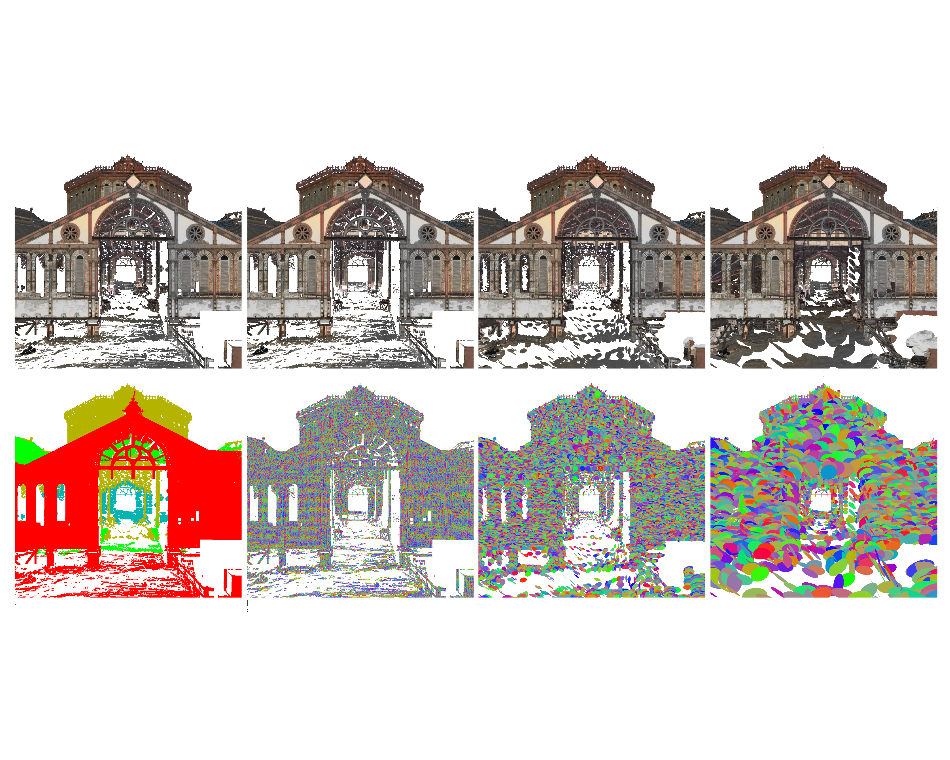
Normal vectors are essential for many point cloud operations, including segmentation, reconstruction and rendering. The robust estimation of normal vectors from 3D range scans is a challenging task due to undersampling and noise, specially when combining points sampled from multiple sensor locations. Our error model assumes a Gaussian distribution of the range error with spatially-varying variances that depend on sensor distance and reflected intensity, mimicking the features of Lidar equipment. In this paper we study the impact of measurement errors on the covariance matrices of point neighborhoods. We show that covariance matrices of the true surface points can be estimated from those of the acquired points plus sensordependent directional terms. We derive a lower bound on the neighbourhood size to guarantee that estimated matrix coefficients will be within a predefined error with a prescribed probability. This bound is key for achieving an optimal trade-off between smoothness and fine detail preservation. We also propose and compare different strategies for handling neighborhoods with samples coming from multiple materials and sensors. We show analytically that our method provides better normal estimates than competing approaches in noise conditions similar to those found in Lidar equipment.
Computers & Graphics, Vol. 73, pp 1--16, 2018.
DOI: http://dx.doi.org/10.1016/j.cag.2018.02.007
DOI: http://dx.doi.org/10.1016/j.cag.2018.02.007
BibTeX
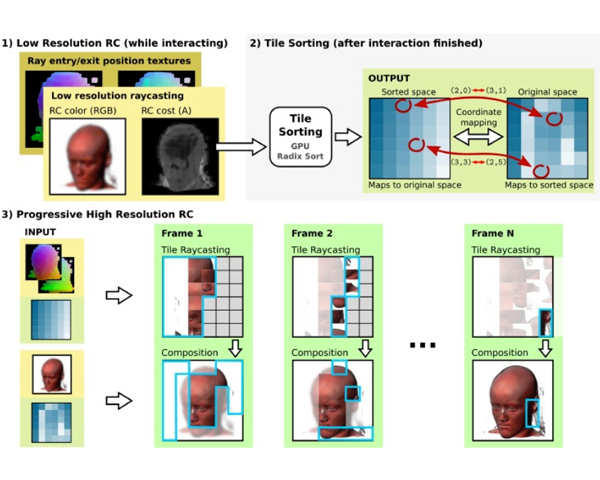
Mobile devices have experienced an incredible market penetration in the last decade. Currently, medium to premium smartphones
are relatively a
ordable devices. With the increase in screen size and resolution, together with the improvements in performance of
mobile CPUs and GPUs, more tasks have become possible. In this paper we explore the rendering of medium to large volumetric
models on mobile and low performance devices in general. To do so, we present a progressive ray casting method that is able to
obtain interactive frame rates and high quality results for models that not long ago were only supported by desktop computers.
Proc.ACM Transactions on Computer Graphics, Proc. SIGGRAPH Asia., Vol. 37, Num. 6, pp 235:1--235:12, 2018.
DOI: http://dx.doi.org/10.1145/3272127.3275110
DOI: http://dx.doi.org/10.1145/3272127.3275110
BibTeX
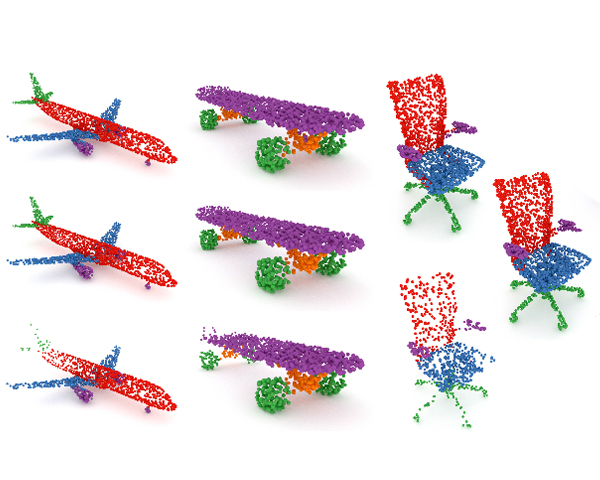
Deep learning systems extensively use convolution operations to process
input data. Though convolution is clearly defined for structured data such
as 2D images or 3D volumes, this is not true for other data types such as
sparse point clouds. Previous techniques have developed approximations to
convolutions for restricted conditions. Unfortunately, their applicability is
limited and cannot be used for general point clouds. We propose an efficient
and effective method to learn convolutions for non-uniformly sampled point
clouds, as they are obtained with modern acquisition techniques. Learning
is enabled by four key novelties: first, representing the convolution kernel
itself as a multilayer perceptron; second, phrasing convolution as a Monte
Carlo integration problem, third, using this notion to combine information
from multiple samplings at different levels; and fourth using Poisson disk
sampling as a scalable means of hierarchical point cloud learning. The key
idea across all these contributions is to guarantee adequate consideration of
the underlying non-uniform sample distribution function from a Monte Carlo
perspective. To make the proposed concepts applicable to real-world tasks,we furthermore propose an efficient implementation which significantly
reduces the GPU memory required during the training process. By employing
our method in hierarchical network architectures we can outperform most
of the state-of-the-art networks on established point cloud segmentation,
classification and normal estimation benchmarks. Furthermore, in contrast to
most existing approaches, we also demonstrate the robustness of our method
with respect to sampling variations, even when training with uniformly
sampled data only. To support the direct application of these concepts,
we provide a ready-to-use TensorFlow implementation of these layers at
https://github.com/viscom-ulm/MCCNN.
A General Illumination Model for Molecular Visualization
Computer Graphics Forum, Vol. 37, Num. 3, pp 367--378, 2018.
DOI: http://dx.doi.org/10.1111/cgf.13426
DOI: http://dx.doi.org/10.1111/cgf.13426
BibTeX
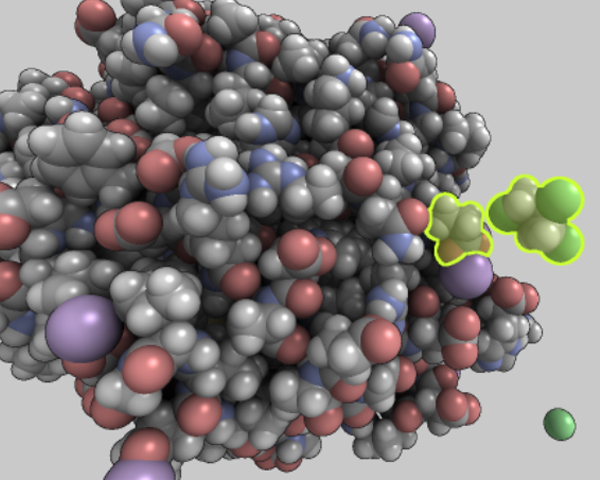
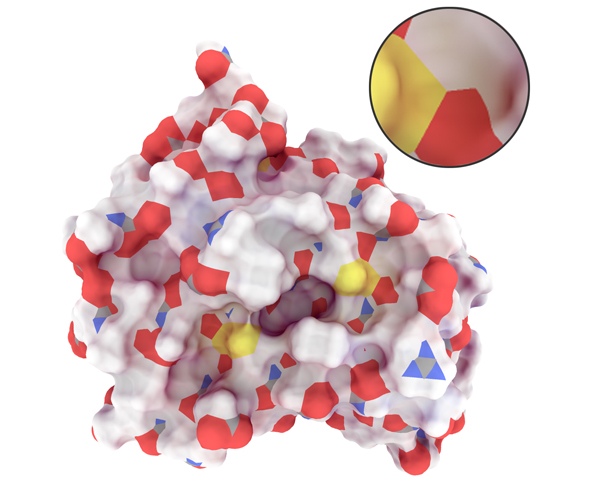
Several visual representations have been developed over the years to visualize molecular structures, and to enable a better
understanding of their underlying chemical processes. Today, the most frequently used atom-based representations are the
Space-filling, the Solvent Excluded Surface, the Balls-and-Sticks, and the Licorice models. While each of these representations
has its individual benefits, when applied to large-scale models spatial arrangements can be difficult to interpret when employing
current visualization techniques. In the past it has been shown that global illumination techniques improve the perception of
molecular visualizations; unfortunately existing approaches are tailored towards a single visual representation. We propose a
general illumination model for molecular visualization that is valid for different representations. With our illumination model,
it becomes possible, for the first time, to achieve consistent illumination among all atom-based molecular representations. The
proposed model can be further evaluated in real-time, as it employs an analytical solution to simulate diffuse light interactions
between objects. To be able to derive such a solution for the rather complicated and diverse visual representations, we propose
the use of regression analysis together with adapted parameter sampling strategies as well as shape parametrization guided
sampling, which are applied to the geometric building blocks of the targeted visual representations. We will discuss the proposed
sampling strategies, the derived illumination model, and demonstrate its capabilities when visualizing several dynamic
molecules.
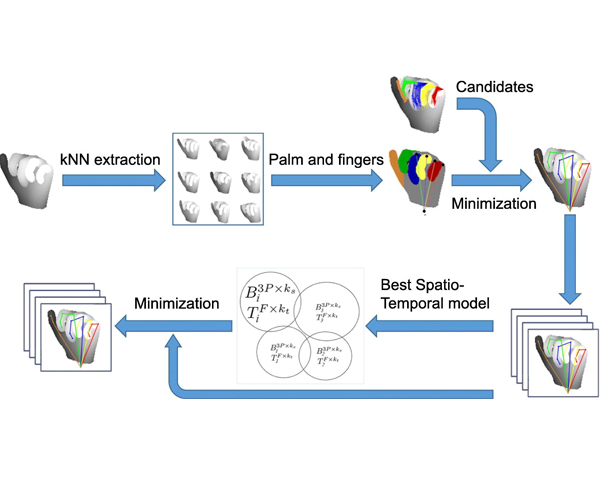
Top-down model fitting for hand pose recovery in sequences of depth images
Image and Vision Computing, Vol. 79, pp 63--75, 2018.
DOI: http://dx.doi.org/10.1016/j.imavis.2018.09.006
DOI: http://dx.doi.org/10.1016/j.imavis.2018.09.006
BibTeX
State-of-the-art approaches on hand pose estimation from depth images have reported promising results under quite controlled considerations. In this paper we propose a two-step pipeline for recovering the hand pose from a sequence of depth images. The pipeline has been designed to deal with images taken from any viewpoint and exhibiting a high degree of finger occlusion. In a first step we initialize the hand pose using a part-based model, fitting a set of hand components in the depth images. In a second step we consider temporal data and estimate the parameters of a trained bilinear model consisting of shape and trajectory bases. We evaluate our approach on a new created synthetic hand dataset along with NYU and MSRA real datasets. Results demonstrate that the proposed method outperforms the most recent pose recovering approaches, including those based on CNNs.
Computer Graphics Forum, Vol. 37, Num. 3, pp 391--402, 2018.
DOI: http://dx.doi.org/10.1111/cgf.13428
DOI: http://dx.doi.org/10.1111/cgf.13428
BibTeX
The analysis of protein-ligand interactions is complex
because of the many factors at play. Most current methods for
visual analysis provide this information in the form of simple 2D
plots, which, besides being quite space hungry, often encode a low
number of different properties. In this paper we present a system for compact
2D visualization of molecular simulations. It purposely omits most spatial information and presents physical information associated to single molecular components and their pairwise interactions through a set of 2D InfoVis tools with coordinated views, suitable interaction, and focus+context techniques to analyze large amounts of data. The system provides a wide range of motifs for elements such as protein secondary structures or hydrogen bond networks, and a set of tools for their interactive inspection, both for a single simulation and for comparing two different simulations. As a result, the analysis of protein-ligand interactions of Molecular Simulation trajectories is greatly facilitated.
3D4LIFE Conferences Results
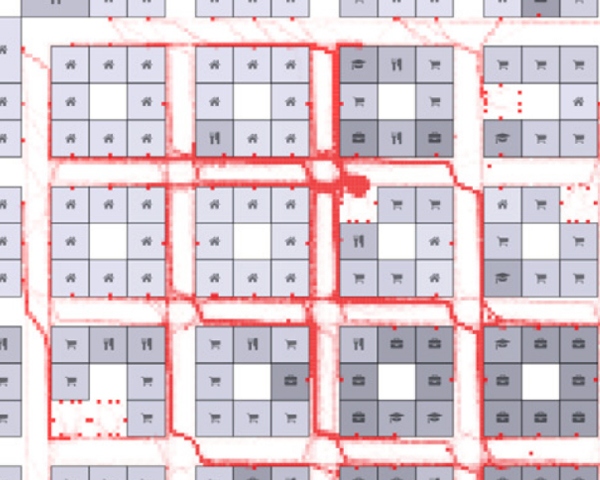
Visual Analysis of Environmental Noise Data
Proc. 16th International Conference on Computer Graphics, Visualization, Computer Vision and Image Processing (CGVCVIP 2022), IADIS Press, pp 45--53, 2022.
BibTeX
Smart cities generate a large amount of information that, if used properly, can help improve people s quality of life, while
providing environmental support. Decreasing pollution generated by noise, is a prevailing concern, in today s society.
A group of experts has collected data in different areas of l Escaldes-Engordany, in Andorra. These areas have been
separated according to traffic policies, i.e., the fully pedestrian ones, the fully vehicular ones, and the combined ones.
Analyzing the resulting data may be a complex task, where optimal tools are not available; hence, we have developed a visualization application that allows comparisons and analysis. The main purpose is to improve the conditions in decision
making, by having accurate information so that policymakers may have a better understanding of how different transit
levels configure the noise landscape, and how contrasting sounds are distributed throughout time. To achieve this, we have
developed a visualization application that allows overviewing, detailed individual analysis, and comparative views to
parameterize the results of the policies adopted and be in a better position to improve them.
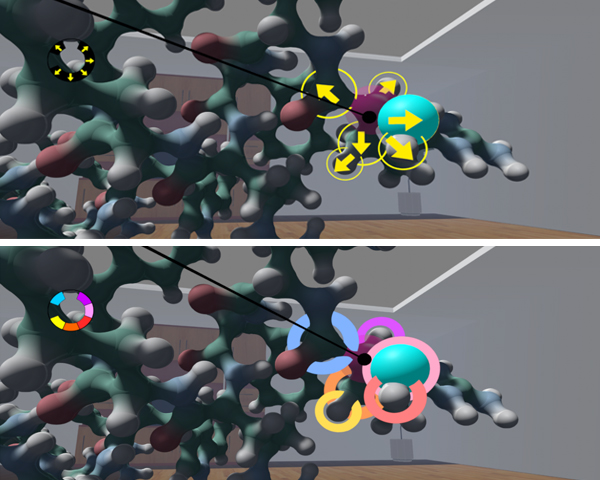
Accurate molecular atom selection in VR
Accurate selection in cluttered scenes is complex because a high amount of precision is required. In Virtual Reality Environments,
it is even worse because it is more difficult for us to point a small object with our arms in the air. Not only our arms
move slightly, but the button/trigger press reduces our weak stability. In this paper, we present two alternatives to the classical
ray pointing intended to facilitate the selection of atoms in molecular environments. We have implemented and analyzed such
techniques through an informal user study and found that they were highly appreciated by the users. This selection method
could be interesting in other crowded environments beyond molecular visualization.
The use of self-avatars in a VR application can enhance presence and embodiment which leads to a better user experience.
In collaborative VR it also facilitates non-verbal communication. Currently it is possible to track a few body parts with cheap
trackers and then apply IK methods to animate a character. However, the correspondence between trackers and avatar joints is
typically fixed ad-hoc, which is enough to animate the avatar, but causes noticeable mismatches between the user’s body pose
and the avatar. In this paper we present a fast and easy to set up system to compute exact offset values, unique for each user,
which leads to improvements in avatar movement. Our user study shows that the Sense of Embodiment increased significantly
when using exact offsets as opposed to fixed ones. We also allowed the users to see a semitransparent avatar overlaid with their
real body to objectively evaluate the quality of the avatar movement with our technique.
Spanish Computer Graphics Conference (CEIG), pp 15--18, 2021.
DOI: http://dx.doi.org/10.2312/ceig.20211357
DOI: http://dx.doi.org/10.2312/ceig.20211357
BibTeX
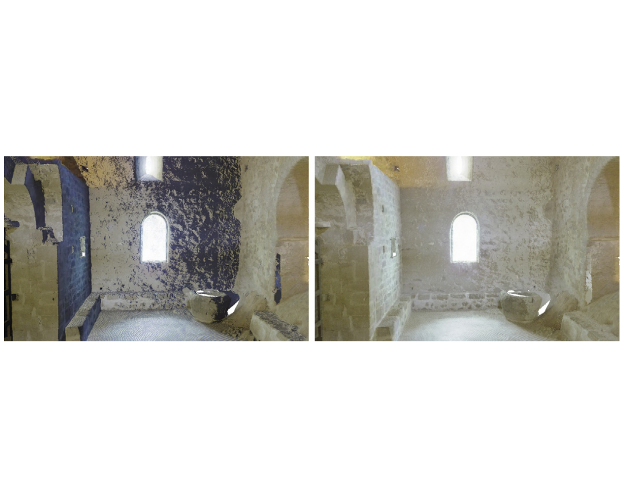
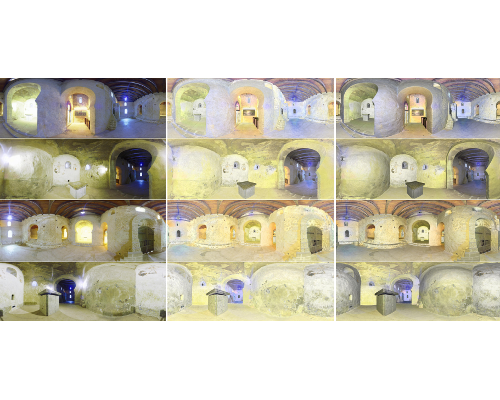
Terrestrial Laser Scanners, also known as LiDAR, are often equipped with color cameras so that both infrared and RGB values are measured for each point sample. High-end scanners also provide panoramic High Dynamic Range (HDR) images. Rendering such HDR colors on conventional displays requires a tone-mapping operator, and getting a suitable exposure everywhere on the image can be challenging for 360° indoor scenes with a variety of rooms and illumination sources. In this paper we present a simple-to-implement tone mapping algorithm for HDR panoramas captured by LiDAR equipment. The key idea is to choose, on a per-pixel basis, an exposure correction factor based on the local intensity (infrared reflectivity). Since LiDAR intensity values for indoor scenes are nearly independent from the external illumination, we show that intensity-guided exposure correction often outperforms state-of-the-art tone-mapping operators on this kind of scenes.
Spanish Computer Graphics Conference (CEIG), pp 9--14, 2021.
DOI: http://dx.doi.org/10.2312/ceig.20211356
DOI: http://dx.doi.org/10.2312/ceig.20211356
BibTeX
Laser scanners enable the digitization of 3D surfaces by generating a point cloud where each point sample includes an intensity (infrared reflectivity) value. Some LiDAR scanners also incorporate cameras to capture the color of the surfaces visible from
the scanner location. Getting usable colors everywhere across 360 scans is a challenging task, especially for indoor scenes.
LiDAR scanners lack flashes, and placing proper light sources for a 360 indoor scene is either unfeasible or undesirable. As a
result, color data from LiDAR scans often do not have an adequate quality, either because of poor exposition (too bright or too
dark areas) or because of severe illumination changes between scans (e.g. direct Sunlight vs cloudy lighting). In this paper, we
present a new method to recover plausible color data from the infrared data available in LiDAR scans. The main idea is to train
an adapted image-to-image translation network using color and intensity values on well-exposed areas of scans. At inference
time, the network is able to recover plausible color using exclusively the intensity values. The immediate application of our
approach is the selective colorization of LiDAR data in those scans or regions with missing or poor color data.

Analysis and Visual Exploration of Prediction Algorithms for Public Bicycle Sharing Systems
15th International Conference on Computer Graphics, Visualization, Computer Vision and Image Processing (CGVCVIP 2021), pp 61--70, 2021.
BibTeX
Public bicycle sharing systems have become an increasingly popular means of transportation in many cities around the world. However, the information shown in mobile apps or websites is commonly limited to the system’s current status and is of little use for both citizens and responsible planning entities. The vast amount of data produced by these managing systems makes it feasible to elaborate and present predictive models that may help its users in the decision-making process. For example, if a user finds a station empty, the application could provide an estimation of when a new bicycle would be available. In this paper, we explore the suitability of several prediction algorithms applied to this case of bicycle availability, and we present a web-based tool to visually explore their prediction errors under different time frames. Even though a quick quantitative analysis may initially suggest that Random Forest yields a lower error, our visual exploration interface allows us to perform a more thorough analysis and detect subtle but relevant differences between algorithms depending on variables such as the stations behavior, hourly intervals, days, or types of days (weekdays and weekends). This case illustrates the potential of visual representation together with quantitative metrics to compare prediction algorithms with a higher level of detail, which can, in turn, assist application designers and decision-makers to dynamically adjust the best model for their specific scenarios.
Computer Science Research Notes (Proc. WSCG 2021), 2021.
DOI: http://dx.doi.org/10.24132/CSRN.2021.3002.23
DOI: http://dx.doi.org/10.24132/CSRN.2021.3002.23
BibTeX
Nowadays, public bicycle sharing systems have become popular and widespread across the world. Their usefulness
largely depends on their ability to synchronize with citizens’ usage patterns and optimize re-balancing operations
that must be carried out to reduce outages. Two crucial factors to tackle this problem are stations’ characteristics
(geography, location, etc) and the availability of bikes and drop-off slots. Based on the requirements and input from
regular users and experts in policy-making, system operation, and urban planning, we have created a web-based
visualization system that facilitates the analysis of docking stations’ behavior. This system provides the first group
with the availability prediction of both bike and free slots in docking stations to assist their planning. Besides,
the system helps the second group understand patterns of usage and get deeper insights (e.g. need for resizing or
complementary transportation systems) to facilitate decision-making and better fulfill the citizens’ needs. In a final
evaluation, both groups found it highly useful, effective, and better suited than other existent applications.
EG GCH - Eurographics Workshop on Graphics and Cultural Heritage, pp 21--30, 2021.
DOI: http://dx.doi.org/10.2312/gch.20211402
DOI: http://dx.doi.org/10.2312/gch.20211402
BibTeX
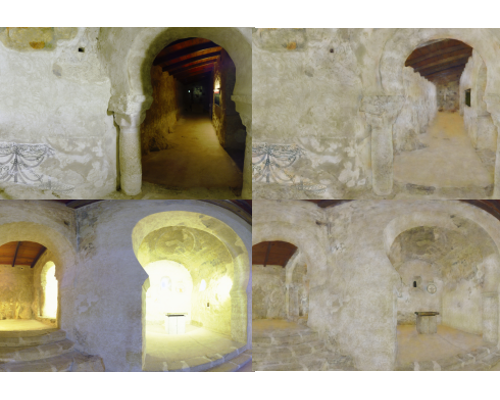
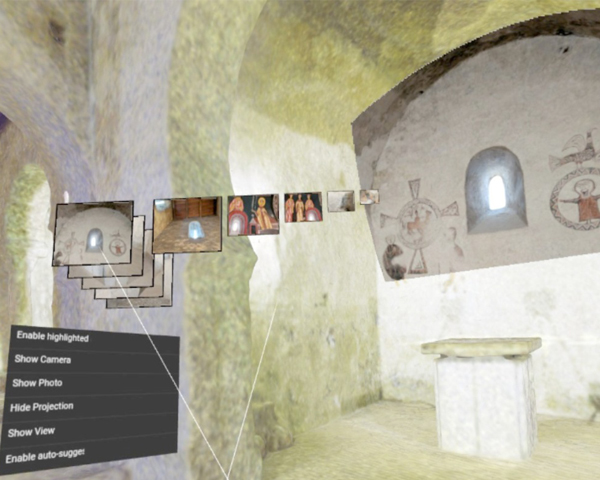
Recent advances in 3D acquisition technologies have facilitated the inexpensive digitization of cultural heritage. In addition to the 3D digital model, in many cases multiple photo collections are also available. These photo collections often provide valuable information not included in the 3D digital model. In this paper we describe a VR-ready web application to simultaneously explore a cultural heritage model together with arbitrary photo collections. At any time, users can define a region of interest either explicitly or implicitly, and the application retrieves, scores, groups and shows a matching subset of the photos. Users can then select a photo to project it onto the 3D model, to inspect the photo separately, or to teleport to the position the photo was taken from. Unlike previous approaches for joint 2D-3D model exploration, our interface has been specifically adapted to VR. We conducted a user study and found that the application greatly facilitates navigation and provides a fast, intuitive access to the available photos. The application supports any modern browser running on desktop, mobile and VR headset systems.

International Conference on Learning Representations, ICLR 2021: Vienna, Austria, pp 1--16, 2021.
DOI: http://dx.doi.org
DOI: http://dx.doi.org
BibTeX
Proteins perform a large variety of functions in living organisms and thus playa key role in biology. However, commonly used algorithms in protein learningwere not specifically designed for protein data, and are therefore not able tocapture all relevant structural levels of a protein during learning. To fill this gap,we propose two new learning operators, specifically designed to process proteinstructures. First, we introduce a novel convolution operator that considers theprimary, secondary, and tertiary structure of a protein by usingn-D convolutionsdefined on both the Euclidean distance, as well as multiple geodesic distancesbetween the atoms in a multi-graph. Second, we introduce a set of hierarchicalpooling operators that enable multi-scale protein analysis. We further evaluate theaccuracy of our algorithms on common downstream tasks, where we outperformstate-of-the-art protein learning algorithms.

Web3D '21: The 26th International Conference on 3D Web Technology, pp 1-6, 2021.
DOI: http://dx.doi.org/10.1145/3485444.3487643
DOI: http://dx.doi.org/10.1145/3485444.3487643
BibTeX
Navigating through a virtual environment is one of the major user tasks in the 3D web. Although hundreds of interaction techniques have been proposed to navigate through 3D scenes in desktop, mobile and VR headset systems, 3D navigation still poses a high entry barrier for many potential users. In this paper we discuss the design and implementation of a test platform to facilitate the creation and fine-tuning of interaction techniques for 3D navigation. We support the most common navigation metaphors (walking, flying, teleportation). The key idea is to let developers specify, at runtime, the exact mapping between user actions and virtual camera changes, for any of the supported metaphors. We demonstrate through many examples how this method can be used to adapt the navigation techniques to various people including persons with no previous 3D navigation skills, elderly people, and people with disabilities.
The impact of animations in the perception of a simulated crowd
Computer Graphics International, 2021.
BibTeX
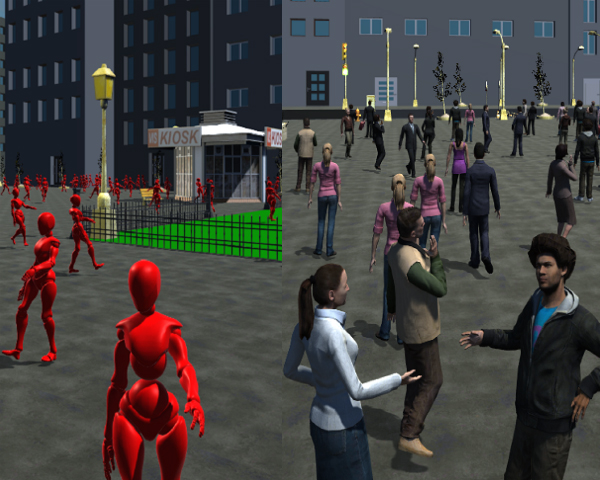
Simulating virtual crowds is an important challenge in many areas such as games and virtual reality applications. A lot of effort has been dedicated to improving pathfinding, collision avoidance, or decision making, to achieve more realistic human-like behavior. However, crowd simulation will be far from appearing realistic as long as virtual humans are limited to walking animations. Including animation variety could greatly enhance the plausibility of the populated environment. In this paper, we evaluated to what extend animation variety can affect the perceived level of realism of a crowd, regardless of the appearance of the virtual agents (bots vs. humanoids). The goal of this study is to provide recommendations for crowd animation and rendering when simulating crowds. Our results show that the perceived realism of the crowd trajectories and animations is significantly higher when using a variety of animations as opposed to simply having locomotion animations, but only if we render realistic humanoids. If we can only render agents as bots, then there is no much gain from having animation variety, in fact, it could potentially lower the perceived quality of the trajectories.

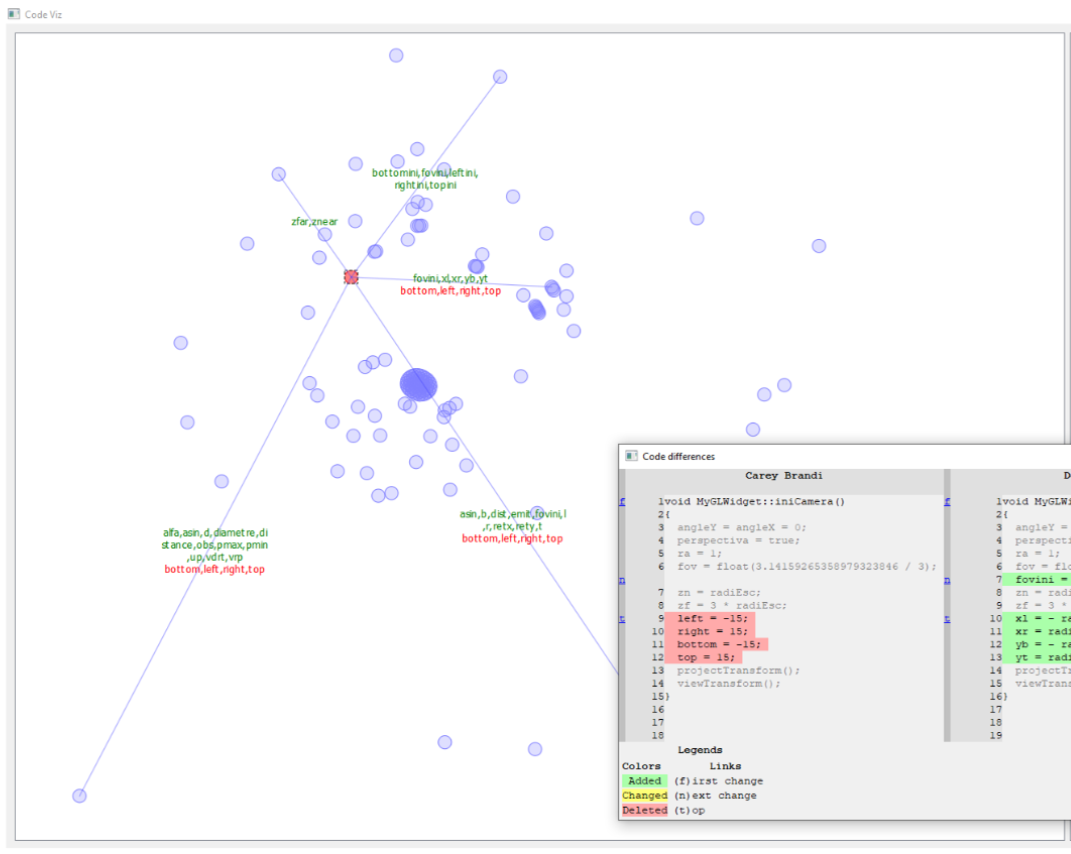
EuroVis 2020, Eurographics/IEEE VGTC Conference on Visualization 2020, pp 151--155, 2020.
DOI: http://dx.doi.org/10.2312/evs.20201064
DOI: http://dx.doi.org/10.2312/evs.20201064
BibTeX
Finding robust correspondences between images is a crucial step in photogrammetry applications. The traditional approach
to visualize sparse matches between two images is to place them side-by-side and draw link segments connecting pixels with
matching features. In this paper we present new visualization techniques for sparse correspondences between image pairs.
Key ingredients of our techniques include (a) the clustering of consistent matches, (b) the optimization of the image layout
to minimize occlusions due to the super-imposed links, (c) a color mapping to minimize color interference among links (d) a
criterion for giving visibility priority to isolated links, (e) the bending of link segments to put apart nearby links, and (f) the use
of glyphs to facilitate the identification of matching keypoints. We show that our technique substantially reduces the clutter in
the final composite image and thus makes it easier to detect and inspect both inlier and outlier matches. Potential applications
include the validation of image pairs in difficult setups and the visual comparison of feature detection / matching algorithms.
EuroVis 2020, Eurographics / IEEE VGTC Conference on Visualization 2020 - Posters, pp 33--35, 2020.
DOI: http://dx.doi.org/https://doi.org/10.2312/eurp.20201122
DOI: http://dx.doi.org/https://doi.org/10.2312/eurp.20201122
BibTeX
Programming exercises are a corner stone in Computer Science courses. If used properly, these exercises provide valuable feedback both to students and instructors. Unfortunately, the assessment of student submissions through code inspection requires a considerable amount of time. In this work we present an interactive tool to support the analysis of code submissions before, during, and after grading. The key idea is to compute a dissimilarity matrix for code submissions, using a metric that incorporates syntactic, semantic and functional aspects of the code. This matrix is used to embed the submissions in 2D space, so that similar submissions are mapped to nearby locations. The tool allows users to visually identify clusters, inspect individual submissions, and perform detailed pair-wise and abridged n-way comparisons. Finally, our approach facilitates comparative scoring by presenting submissions in a nearly-optimal order, i.e. similar submissions appear close in the sequence. Our initial evaluation indicates that the tool (currently supporting C++/GLSL code) provides clear benefits both to students (more fair scores, less bias, more consistent feedback) and instructors (less effort, better feedback on student performance).
18th Eurographics Workshop on Graphics and Cultural Heritage, pp 23--32, 2020.
DOI: http://dx.doi.org/10.2312/gch.20201289
DOI: http://dx.doi.org/10.2312/gch.20201289
BibTeX
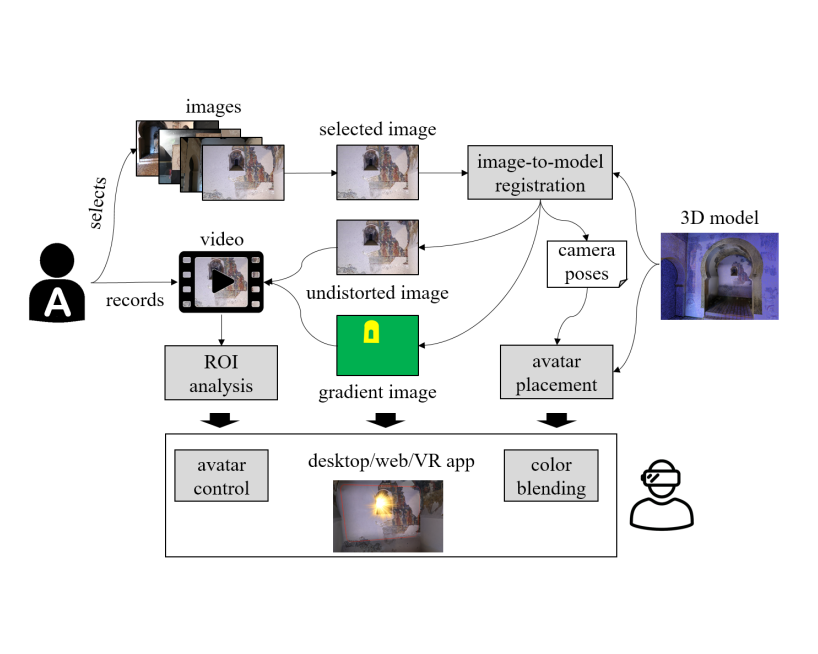
Visual storytelling is a powerful tool for Cultural Heritage communication. However, traditional authoring tools either produce videos that cannot be fully integrated with 3D scanned models, or require 3D content creation skills that imply a high entry barrier for Cultural Heritage experts. In this paper we present an image-supported, video-based authoring tool allowing non-3D-experts to create rich narrative content that can be fully integrated in immersive virtual reality experiences. Given an existing 3D scanned model, each story is based on a user-provided photo or system-proposed image. First, the system automatically registers the image against the 3D model, and creates an undistorted version that will serve as a fixed background image for the story. Authors can then use their favorite presentation software to annotate or edit the image while recording their voice. The resulting video is processed automatically to detect per-frame regions-of-interest. At visualization time, videos are projected onto the 3D scanned model, allowing the audience to watch the narrative piece in its surrounding spatial context. We discuss multiple color blending techniques, inspired by detail textures, to provide high-resolution detail. The system uses the image-to-model registration data to find suitable locations for triggers and avatars that draw the user attention towards the 3D model parts being referred to by the presenter. We conducted an informal user study to evaluate the quality of the immersive experience. Our findings suggest that our approach is a valuable tool for fast and easy creation of fully-immersive visual storytelling experiences.
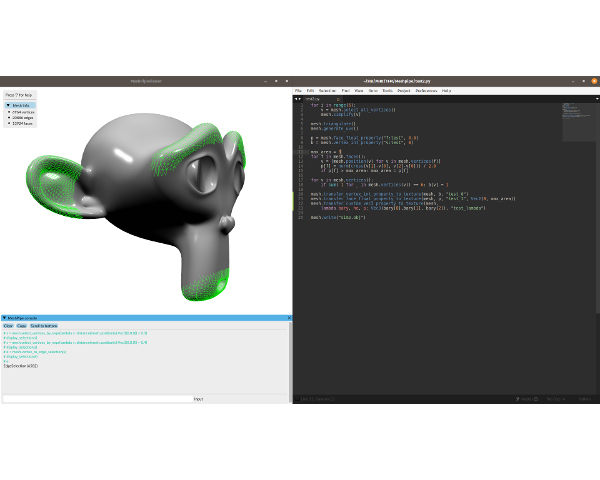
MeshPipe: A Python-based Tool for Easy Automation and Demonstration of Geometry Processing Pipelines
The popularization of inexpensive 3D scanning, 3D printing, 3D publishing and AR/VR display technologies have renewed the interest in open-source tools providing the geometry processing algorithms required to clean, repair, enrich, optimize and modify point-based and polygonal-based models. Nowadays, there is a large variety of such open-source tools whose user community includes 3D experts but also 3D enthusiasts and professionals from other disciplines. In this paper we present a Python-based tool that addresses two major caveats of current solutions: the lack of easy-to-use methods for the creation of custom geometry processing pipelines (automation), and the lack of a suitable visual interface for quickly testing, comparing and sharing different pipelines, supporting rapid iterations and providing dynamic feedback to the user (demonstration). From the users point of view, the tool is a 3D viewer with an integrated Python console from which internal or external Python code can be executed. We provide an easy-to-use but powerful API for element selection and geometry processing. Key algorithms are provided by a high-level C library exposed to the viewer via Python-C bindings. Unlike competing open-source alternatives, our tool has a minimal learning curve and typical pipelines can be written in a few lines of Python code.
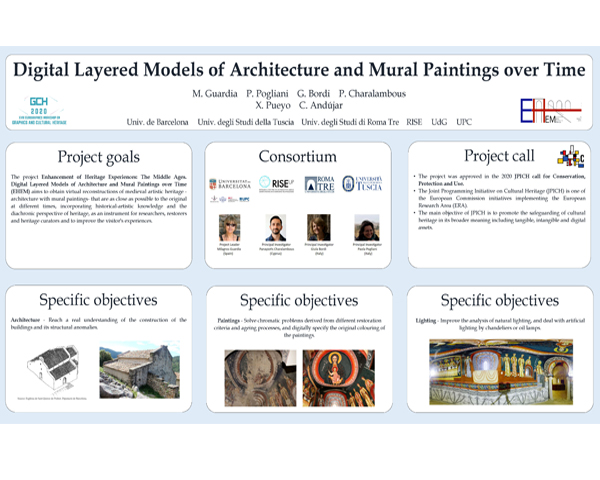
18th Eurographics Workshop on Graphics and Cultural Heritage, pp 79, 2020.
DOI: http://dx.doi.org/10.2312/gch.20201295
DOI: http://dx.doi.org/10.2312/gch.20201295
BibTeX
The European project Enhancement of Heritage Experiences: The Middle Ages. Digital Layered Models of Architecture and Mural Paintings over Time (EHEM), approved in the call for JPICH Conservation, Protection and Use (0127) in the year 2020, aims to obtain virtual reconstructions of medieval artistic heritage - architecture with mural paintings - that are as close as possible to the original at different times, incorporating historical-artistic knowledge and the diachronic perspective of heritage, as an instrument for researchers, restorers and heritage curators and to improve the visitor's perceptions and experiences.
Avatars rendering and its effect on perceived realism in Virtual Reality
MARCH: Modeling and Animating Realistic Crowds and Humans; Workshop in 3rd IEEE International Conference on Artificial Intelligence and Virtual Reality (AIVR) , 2020.
BibTeX
Immersive virtual environments have proven to be a plausible platform to be used by multiple disciplines to simulate different types of scenarios and situations at a low cost.
When participants are immersed in a virtual environment experience presence, they are more likely to behave as if they were in the real world. Improving the level of realism should provide a more compelling scenario so that users will experience higher levels of presence, and thus be more likely to behave as if they were in the real world. This paper presents preliminary results of an experiment in which participants navigate through two versions of the same scenario with different levels of realism of both the environment and the avatars. Our current results, from a between subjects experiment, show that the reported levels of quality in the visualization are not significantly different, which means that other aspects of the virtual environment and/or avatars must be taken into account in order to improve the perceived level of realism.

Comunicaciones del I Congreso de la Red Española de Investigación del Rendimiento Deportivo en Ciclismo y Mujer (REDICYM), pp 1--1, 2020.
BibTeX
Los algoritmos basados en reconocimiento de la imagen cada vez son más precisos
y pueden ser usados para capturar el movimiento del esqueleto humano, como OpenPose
(librería deep-learning). Sin embargo, estos algoritmos tienen dificultades cuando hay oclusiones.
Es el caso de la captura de movimientos en el ciclismo (una pierna queda parcialmente ocultada).
Objetivo: En primer lugar, se ha desarrollado un algoritmo de corrección para detectar
automáticamente la cadera, rodilla, tobillo, y los puntos del pie cuando no son visibles. En
segundo lugar, se ha integrado la cinemática medida con un sistema de sensores de fuerza low-
cost, que mide las fuerzas externas, para realizar el análisis dinámico inverso y estimar los
momentos articulares. Métodos: Se capturó el movimiento del pedaleo y las fuerzas de contacto al
sillín y a los pedales de cinco sujetos. La cinemática angular fue calculada a partir de los datos de
OpenPose y del algoritmo correctivo. Los análisis dinámicos se realizaron en OpenSim para
estimar los momentos articulares, y seguidamente, las potencias articulares. La precisión de la
cinemática fue evaluada comparando los resultados con trayectorizaciones manuales. Resultados:
La media del error RMS fue menor de 2º, 4.5º, y 11º en la cadera, rodilla y tobillo,
respectivamente. La cinemática, dinámica y potencias articulares fueron coherentes en términos
biomecánicos. Discusión: La cinemática, dinámica y potencia articulares son comparables con los
resultados de la literatura. La hipótesis de despreciar las fuerzas tangenciales se tendría que
evaluar en detalle. Las funciones MATLAB para utilizar los algoritmos descritos están disponible
online. Conclusión: El sistema marker-less desarrollado representa un método prometedor
para analizar la cinemática y dinámica en el ciclismo.
A Parser-based Tool to Assist Instructors in Grading Computer Graphics Assignments
40th Annual Conference of the European Association for Computer Graphics, Education papers, pp 21--28, 2019.
DOI: http://dx.doi.org/10.2312/eged.20191025
DOI: http://dx.doi.org/10.2312/eged.20191025
BibTeX
Colonic content assessment from MRI imaging using a semi-automatic approach
Eurographics Workshop on Visual Computing for Biology and Medicine. EG VCBM 2019, pp 17-26, 2019.
DOI: http://dx.doi.org/10.2312/vcbm.20191227
DOI: http://dx.doi.org/10.2312/vcbm.20191227
BibTeX
The analysis of the morphology and content of the gut is necessary in order to achieve a better understanding of its metabolic
and functional activity. Magnetic resonance imaging (MRI) has become an important imaging technique since it is able to
visualize soft tissues in an undisturbed bowel using no ionizing radiation.
In the last few years, MRI of gastrointestinal function has advanced substantially. However, few studies have focused on the
colon, because the analysis of colonic content is time consuming and cumbersome.
This paper presents a semi-automatic segmentation tool for the quantitative assessment of the unprepared colon from MRI
images. The techniques developed here have been crucial for a number of clinical experiments.
CEIG-Spanish Computer Graphics Conference (2019), pp 51--57, 2019.
DOI: http://dx.doi.org/10.2312/ceig.20191203
DOI: http://dx.doi.org/10.2312/ceig.20191203
BibTeX
Nowadays, there are multiple available range scanning technologies which can capture extremely detailed models of realworld surfaces. The result of such process is usually a set of point clouds which can contain billions of points. While these point clouds can be used and processed offline for a variety of purposes (such as surface reconstruction and offline rendering) it is unfeasible to interactively visualize the raw point data. The most common approach is to use a hierarchical representation to render varying-size oriented splats, but this method also has its limitations as usually a single color is encoded for each point sample. Some authors have proposed the use of color-textured splats, but these either have been designed for offline rendering or do not address the efficient encoding of image datasets into textures. In this work, we propose extending point clouds by encoding their color information into textures and using a pruning and scaling rendering algorithm to achieve interactive rendering. Our approach can be combined with hierarchical point-based representations to allow for real-time rendering of massive point clouds in commodity hardware.
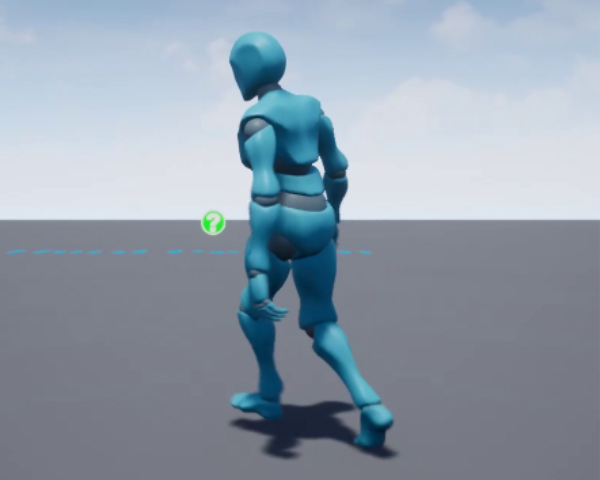
ACM Conference on Motion Interaction and Games (MIG'19), pp 1--6, 2019.
DOI: http://dx.doi.org/10.1145/3359566.3360063
DOI: http://dx.doi.org/10.1145/3359566.3360063
BibTeX
Achieving realistic virtual humans is crucial in virtual reality appli-cations and video games. Nowadays there are software and gamedevelopment tools, that are of great help to generate and simulatecharacters. They offer easy to use GUIs to create characters bydragging and drooping features, and making small modifications.Similarly, there are tools to create animation graphs and settingblending parameters among others. Unfortunately, even thoughthese tools are relatively user friendly, achieving natural animationtransitions is not straight forward and thus non-expert users tendto spend a large amount of time to generate animations that arenot completely free of artefacts. In this paper we present a methodto automatically generate animation blend spaces in Unreal engine,which offers two advantages: the first one is that it provides a toolto evaluate the quality of an animation set, and the second one isthat the resulting graph does not depend on user skills and it isthus not prone to user errors.
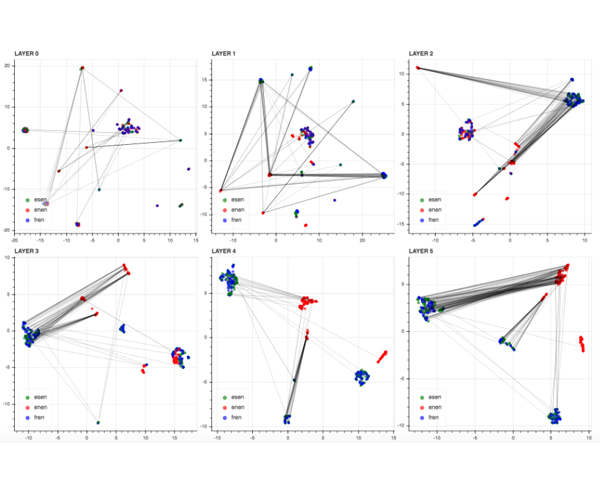
Conference on Empirical Methods in Natural Language Processing (EMNLP) and 9th International Joint Conference on Natural Language Processing (IJCNLP), pp 151–156, 2019.
DOI: http://dx.doi.org/10.18653/v1/D19-3026
DOI: http://dx.doi.org/10.18653/v1/D19-3026
BibTeX
The main alternatives nowadays to deal with sequences are Recurrent Neural Networks (RNN), Convolutional Neural Networks (CNN) architectures and the Transformer. In this context, RNNs, CNNs and Transformer have most commonly been used as an encoder-decoder architecture with multiple layers in each module. Far beyond this, these architectures are the basis for the contextual word embeddings which are revolutionizing most natural language downstream applications. However, intermediate layer representations in sequence-based architectures can be difficult to interpret. To make each layer representation within these architectures more accessible and meaningful, we introduce a web-based tool that visualizes them both at the sentence and token level. We present three use cases. The first analyses gender issues in contextual word embeddings. The second and third are showing multilingual intermediate representations for sentences and tokens and the evolution of these intermediate representations along the multiple layers of the decoder and in the context of multilingual machine translation.
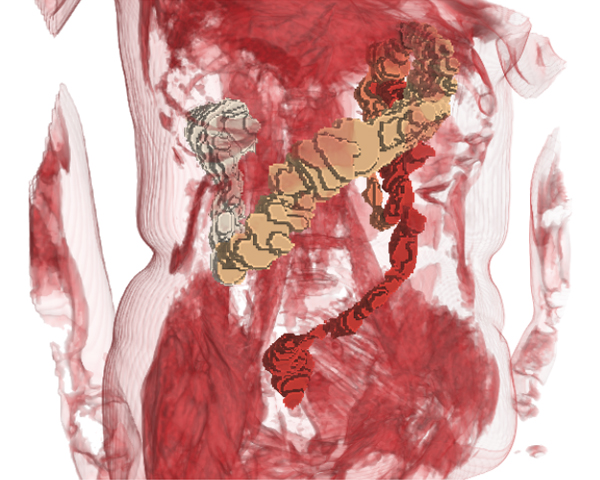
Eurographics Workshop on Visual Computing for Biology and Medicine (EG VCBM 2019)-Short papers, pp 27-31, 2019.
DOI: http://dx.doi.org/10.2312/vcbm.20191228
DOI: http://dx.doi.org/10.2312/vcbm.20191228
BibTeX
The colon is an organ whose constant motility poses difficulties to its analysis. Although morphological data can be successfully extracted from Computational Tomography, its radiative nature makes it only indicated for patients with disorders. Only recently, acquisition techniques that rely on the use of Magnetic Resonance Imaging have matured enough to enable the generation of morphological colon data of healthy patients without preparation (i. e. administration of drugs or contrast agents). As a result, a database of colon morphological data for patients under different diets, has been created. Currently, the digestologists we collaborate with analyze the measured data of the gut by inspecting a set of spreadsheets. In this paper, we propose a system for the exploratory visual analysis of the whole database of morphological data at once. It provides features for the visual comparison of data correlations, the inspection of the morphological measures, as well 3D rendering of the colon segmented models. The system solely relies on the use of web technologies, which makes it portable even to mobile devices.
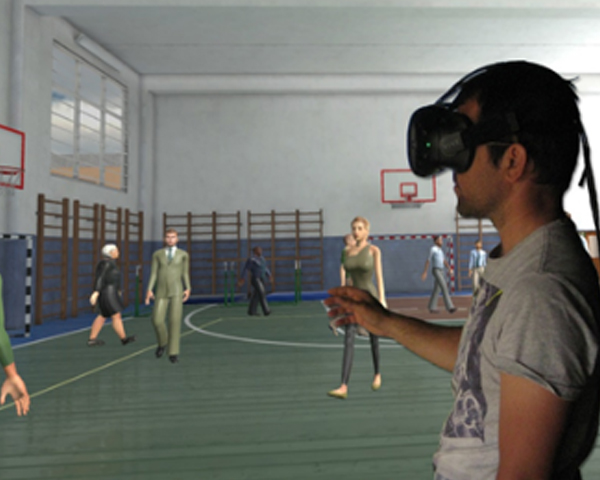
The future of avatar‐human interaction in VR, AR and mixed reality applications.
Eurographics 2019 Think Tank, 2019.
BibTeX
As HMDs and AR technology have become increasingly popular and cheaper, the number of applications is also rapidly increasing. An important remaining challenge with such environments is the faithful representation of virtual humanoids. Not necessarily their visual appearance as much as the naturalness of their motion, behavior and responses. Simulating and animating correctly virtual humanoid for immersive VR and AR sits at the crossing between several research fields: Computer Graphics, Computer Animation, Computer Vision, Machine Learning and Virtual Reality and Mixed Reality. This Think Tank aims at discussing the integration of the latest advancements in the fields mentioned above with the purpose of enhancing VR, AR and mixed reality for populated environments. This session should open the discussion regarding how these different fields could work together to achieve real breakthroughs that go beyond the current state of the art in interaction between avatars and humans.
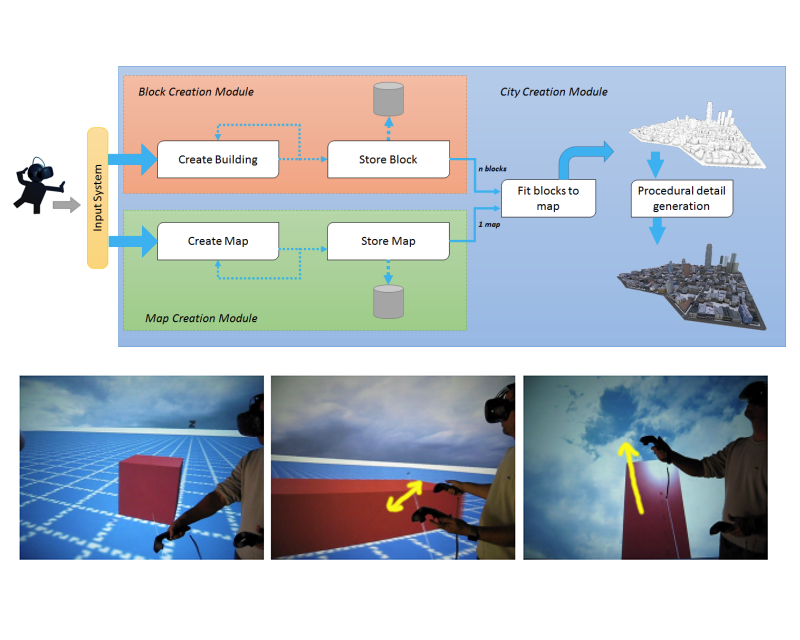
A Virtual Reality Front-end for City Modeling
XXIX Spanish Computer Graphics Conference, CEIG 2019, pp 89--92, 2019.
DOI: http://dx.doi.org/10.2312/ceig.20191210
DOI: http://dx.doi.org/10.2312/ceig.20191210
BibTeX
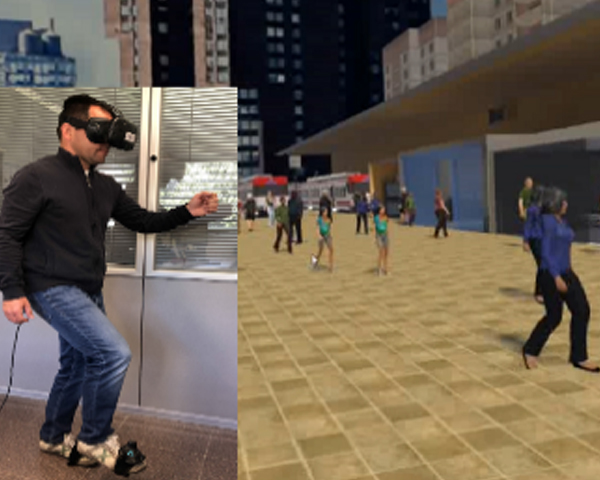
CEIG-Spanish Computer Gra`hics Conference (2019), pp 97--101, 2019.
DOI: http://dx.doi.org/https://doi.org/10.2312/ceig.20191212
DOI: http://dx.doi.org/https://doi.org/10.2312/ceig.20191212
BibTeX
Virtual navigation should be as similar as possible to how we move in the real world, however the limitations of hardware and physical space make this a challenging problem. Tracking natural walk is only feasible when the dimensions of the virtual environment match those of the real world. The problem of most navigation techniques is that they produce motion sickness because the optical flow observed does not match the vestibular and proprioceptive information that appears during real physical movement. Walk in place is a technique that can successfully reduce motion sickness without losing presence in the virtual environment. It is suitable for navigating in a very large virtual environment but it is not usually needed in small virtual spaces. Most current work focuses on one specific navigation metaphor, however in our experience we have observed that if users are given the possibility to use walk in place for large distances, they tend to switch to normal walk when they are in a confined virtual area (such as a small room). Therefore, in this paper we present our ongoing work to seamlessly switch between two navigation metaphors based on leg and head tracking to achieve a more intuitive and natural virtual navigation.
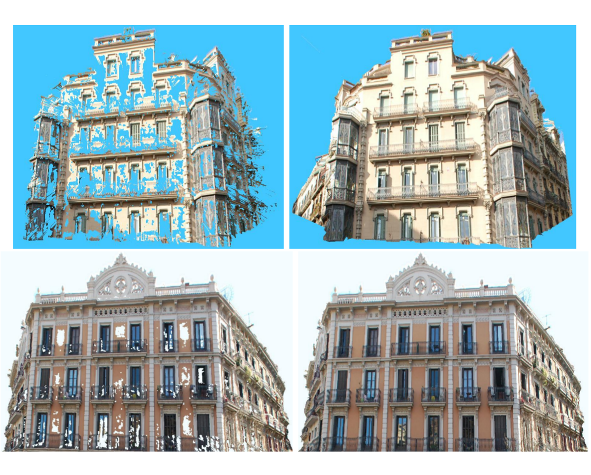
XXVIII Spanish Computer Graphics Conference (CEIG 2018), Madrid, Spain, June 27-29, 2018, pp 25--32, 2018.
DOI: http://dx.doi.org/10.2312/ceig.20181162
DOI: http://dx.doi.org/10.2312/ceig.20181162
BibTeX
Structure-from-motion along with multi-view stereo techniques jointly allow for the inexpensive scanning of 3D objects (e.g. buildings) using just a collection of images taken from commodity cameras. Despite major advances in these fields, a major limitation of dense reconstruction algorithms is that correct depth/normal values are not recovered on specular surfaces (e.g. windows) and parts lacking image features (e.g. flat, textureless parts of the facade). Since these reflective properties are inherent to the surface being acquired, images from different viewpoints hardly contribute to solve this problem. In this paper we present a simple method for detecting, classifying and filling non-valid data regions in depth maps produced by dense stereo algorithms. Triangles meshes reconstructed from our repaired depth maps exhibit much higher quality than those produced by state-of-the-art reconstruction algorithms like Screened Poisson-based techniques.
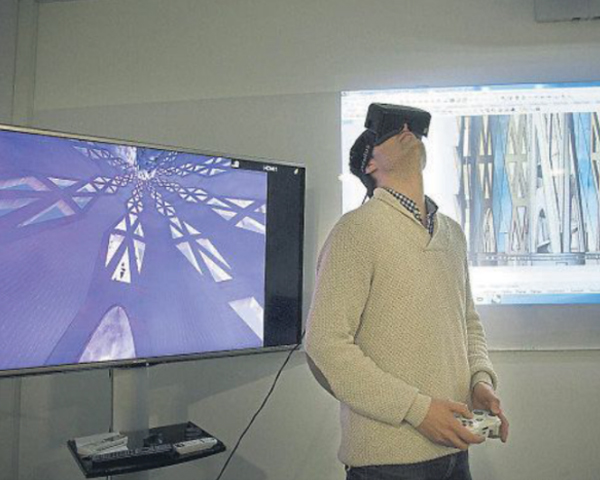
EUROGRAPHICS Workshop on Graphics and Cultural Heritage (EG GCH) . November 12-15. Viena (Austria), pp 47--56, 2018.
DOI: http://dx.doi.org/10.2312/gch.20181340
PDF
DOI: http://dx.doi.org/10.2312/gch.20181340
BibTeX
Virtual Reality (VR) simulations have long been proposed to allow users to explore both yet-to-built buildings in architectural
design, and ancient, remote or disappeared buildings in cultural heritage. In this paper we describe an on-going VR project on
an UNESCO World Heritage Site that simultaneously addresses both scenarios: supporting architects in the task of designing
the remaining parts of a large unfinished building, and simulating existing parts that define the environment that new designs
must conform to. The main challenge for the team of architects is to advance towards the project completion being faithful to
the original Gaudí’s project, since many plans, drawings and plaster models were lost. We analyze the main requirements for
collaborative architectural design in such a unique scenario, describe the main technical challenges, and discuss the lessons
learned after one year of use of the system.
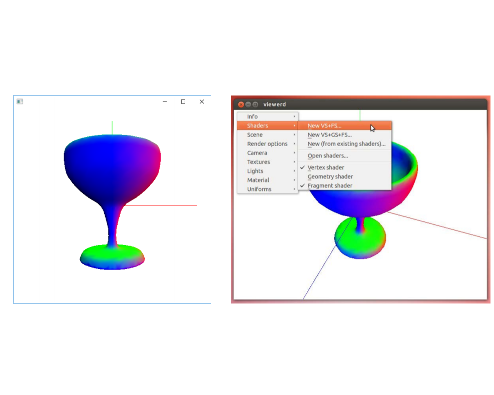
GL-Socket: A CG Plugin-based Framework for Teaching and Assessment
In this paper we describe a plugin-based C++ framework for teaching OpenGL and GLSL in introductory Computer Graphics courses. The main strength of the framework architecture is that student assignments are mostly independent and thus can be completed, tested and evaluated in any order. When students complete a task, the plugin interface forces a clear separation of initialization, interaction and drawing code, which in turn facilitates code reusability. Plugin code can access scene, camera, and OpenGL window methods through a simple API. The plugin interface is flexible enough to allow students to complete tasks requiring shader development, object drawing, and multiple rendering passes. Students are provided with sample plugins with basic scene drawing and camera control features. One of the plugins that the students receive contains a shader development framework with self-assessment features. We describe the lessons learned after using the tool for four years in a Computer Graphics course involving more than one hundred Computer Science students per year.
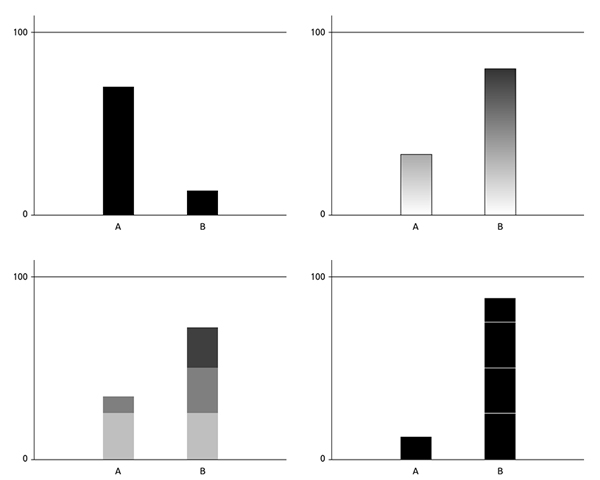
22nd International Conference Information Visualisation, IV 2018, Fisciano, Italy, July 10-13, 2018, pp 159--168, 2018.
DOI: http://dx.doi.org/10.1109/iV.2018.00037
DOI: http://dx.doi.org/10.1109/iV.2018.00037
BibTeX
Bar charts are among the most commonly used visualization graphs. Their main goal is to communicate quantities that can be visually compared. Since they are easy to produce and interpret, they are found in any situation where quantitative data needs to be conveyed (websites, newspapers, etc.). However, depending on the layout, the perceived values can vary substantially. For instance, previous research has shown that the positioning of bars (e.g. stacked vs separate) may influence the accuracy in bar ratio length estimation. Other works have studied the effects of embellishments on the perception of encoded quantities. However, to the best of the authors knowledge, the effect of perceptual elements used to reinforce the quantity depicted within the bars, such as contrast and inner lines, has not been studied in depth. In this research we present a study that analyzes the effect of several internal contrast and framing enhancements with respect to the use of basic solid bars. Our results show that the addition of minimal visual elements that are easy to implement with current technology can help users to better recognize the amounts depicted by the bar charts.
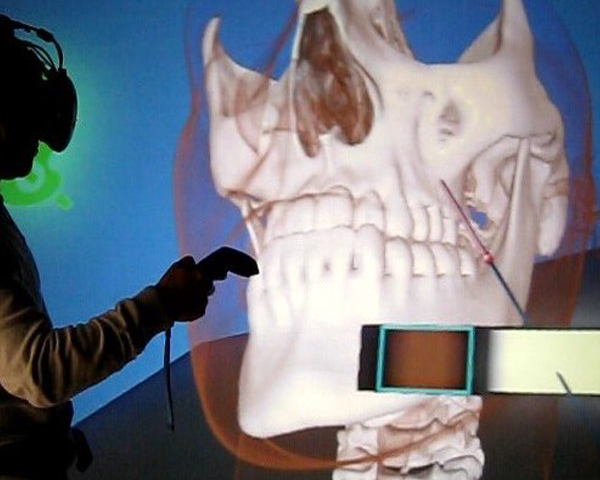
XXVIII Spanish Computer Graphics Conference (CEIG 2018), Madrid, Spain, June 27-29, 2018, pp 47--50, 2018.
DOI: http://dx.doi.org/10.2312/ceig.20181153
DOI: http://dx.doi.org/10.2312/ceig.20181153
BibTeX
The recent advances in VR headsets, such as the Oculus Rift or HTC Vive, at affordable prices offering a high resolution display, has empowered the development of immersive VR applications. data. In this paper we propose an immersive VR system that uses some well-known acceleration algorithms to achieve real-time rendering of volumetric datasets in an immersive
VR system. Moreover, we have incorporated different basic interaction techniques to facilitate the inspection of the volume
dataset. The interaction has been designed to be as natural as possible in order to achieve the most comfortable, user-friendly
virtual experience. We have conducted an informal user study to evaluate the user preferences. Our evaluation shows that our
application is perceived usable, easy of learn and very effective in terms of the high level of immersion achieved
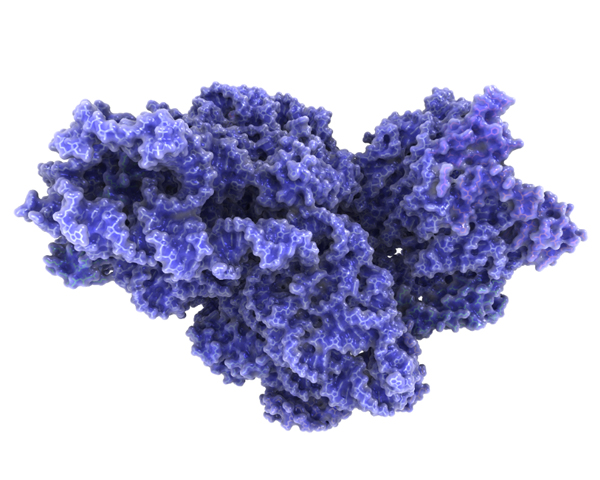
VCBM 18: Eurographics Workshop on Visual Computing for Biology and Medicine, Granada, Spain, September 20-21, 2018, pp 185--195, 2018.
DOI: http://dx.doi.org/10.2312/vcbm.20181244
PDF
DOI: http://dx.doi.org/10.2312/vcbm.20181244
BibTeX
Molecular surfaces are a commonly used representation in the analysis of molecular structures as they provide a compact
description of the space occupied by a molecule and its accessibility. However, due to the high abstraction of the atomic data,
fine grain features are hard to identify. Moreover, these representations involve a high degree of occlusions, which prevents
the identification of internal features and potentially impacts shape perception. In this paper, we present a set of techniques
which are inspired by the properties of translucent materials, that have been developed to improve the perception of molecular
surfaces: First, we introduce an interactive algorithm to simulate subsurface scattering for molecular surfaces, in order to
improve the thickness perception of the molecule. Second, we present a technique to visualize structures just beneath the surface,
by still conveying relevant depth information. And lastly, we introduce reflections and refractions into our visualization that
improve the shape perception of molecular surfaces. We evaluate the benefits of these methods through crowd-sourced user
studies as well as the feedback from several domain experts.
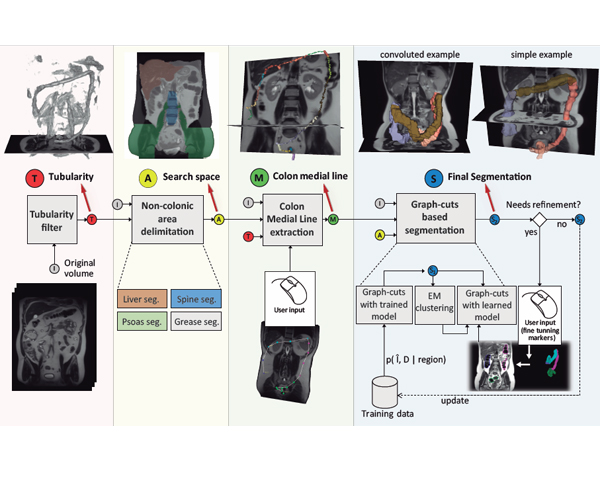
Medical Image Computing and Computer Assisted Intervention - MICCAI 2018 - 21st International Conference, Granada, Spain, September 16-20, 2018, Proceedings, Part {II}, pp 638--647, 2018.
DOI: http://dx.doi.org/10.1007/978-3-030-00934-2\_71
DOI: http://dx.doi.org/10.1007/978-3-030-00934-2\_71
BibTeX
About 50% of the patients consulting a gastroenterology
clinic report symptoms without detectable cause. Clinical researchers
are interested in analyzing the volumetric evolution of colon segments
under the effect of different diets and diseases. These studies require noninvasive
abdominal MRI scans without using any contrast agent. In this
work, we propose a colon segmentation framework designed to support
T2-weighted abdominal MRI scans obtained from an unprepared colon.
The segmentation process is based on an efficient and accurate quasiautomatic
approach that drastically reduces the specialist interaction
and effort with respect other state-of-the-art solutions, while decreasing
the overall segmentation cost. The algorithm relies on a novel probabilistic
tubularity filter, the detection of the colon medial line, probabilistic
information extracted from a training set and a final unsupervised clustering.
Experimental results presented show the benefits of our approach
for clinical use.
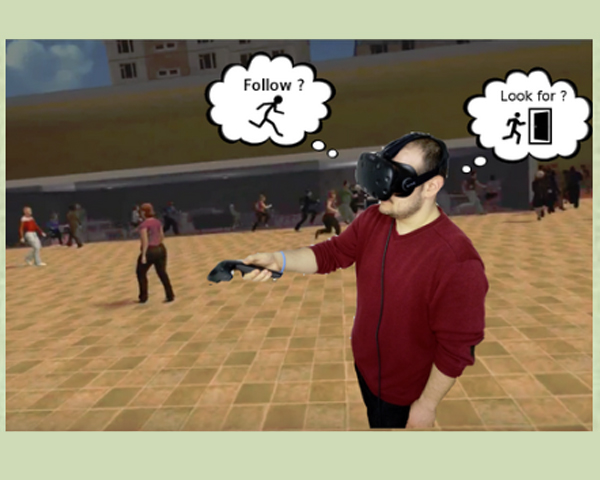
Follower Behavior in a Virtual Environment
Virtual Humans and Crowds in Immersive Environments (VHCIE) . March 18. Reutlingen (Germany), 2018.
PDF
BibTeX
Crowd simulation models typically combine low
level and high level behavior. The low level deals with reactive
behavior and collision avoidance, while the high level deals with
path finding and decision making. There has been a large amount
of work studying collision avoidance manoeuvres for humans
in both virtual reality and from real data. When it comes to
high level behavior, such as decision making when choosing
paths, there have been many approaches to try to simulate the
large variety of possible human decisions, for instance based
on minimizing energy, visibility, or path length combined with
terrain constraints. For long, it has been assumed that in an
emergency situation, humans just follow the behavior of others.
This social behavior has been observed in the real world, and
thus mimicked in crowd simulation models. However there is not
an accurate model yet to determine under what circumstances
this behaviour emerges, and to what extend. This paper focuses
on studying human behavior regarding following others, during
an evacuation situation without imminent danger.
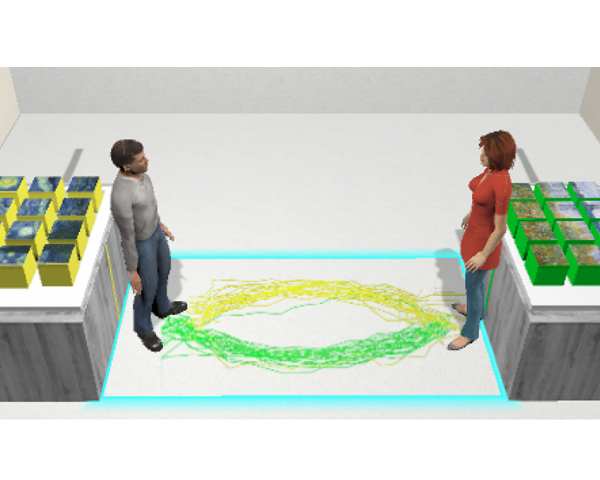
Users locomotor behavior in Collaborative Virtual Reality
Proceedings of the 11th Annual International Conference on Motion, Interaction, and Games, MIG 2018, Limassol, Cyprus, November 08-10, 2018, pp 1--9, 2018.
DOI: http://dx.doi.org/10.1145/3274247.3274513
DOI: http://dx.doi.org/10.1145/3274247.3274513
BibTeX
This paper presents a virtual reality experiment in which two participants share both the virtual and the physical space while performing a collaborative task. We are interested in studying what are the
differences in human locomotor behavior between the real world
and the VR scenario. For that purpose, participants performed the
experiment in both the real and the virtual scenarios. For the VR
case, participants can see both their own animated avatar and the
avatar of the other participant in the environment. As they move,
we store their trajectories to obtain information regarding speeds,
clearance distances and task completion times. For the VR scenario,
we also wanted to evaluate whether the users were aware of subtle
differences in the avatars animations and foot steps sounds. We ran
the same experiment under three different conditions: (1) synchronizing the avatars feet animation and sound of footsteps with the
movement of the participant; (2) synchronizing the animation but
not the sound and finally (3) not synchronizing either one. The results show significant differences in users presence questionnaires
and also different trends in their locomotor behavior between the
real world and the VR scenarios. However the subtle differences
in animations and sound tested in our experiment had no impact on the results of the presence questionnaires, although it showed
a small impact on their locomotor behavior in terms of time to
complete their tasks, and clearance distances kept while crossing
paths.
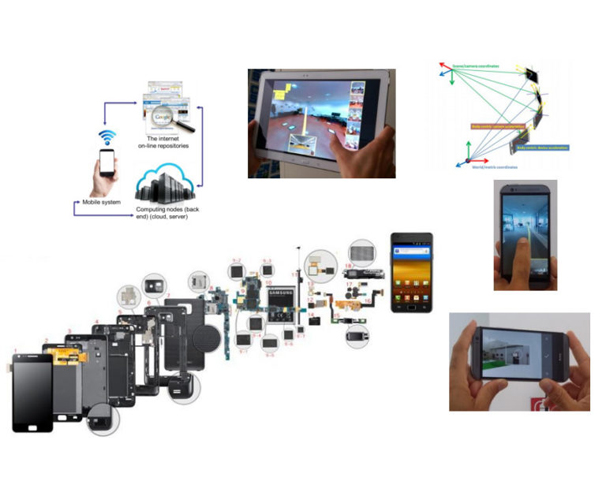
International Conference on 3DVision, Verona, Italy, Sept. 5-8, 2017.
BibTeX
The hardware for mobile devices, from smartphones and tablets to mobile cameras, continues to be one of the fastest-growing areas of the technology market. Not only mobile CPUs and GPUs are rapidly increasing in power, but a variety of high-quality visual and motion sensors are being embedded in mobile solutions. This, together with the increased availability of high-speed networks at lower prices, has opened the door to a variety of novel VR, AR, vision, and graphics applications. This half-day tutorial provides a technical introduction to the mobile graphics world spanning the hardware-software spectrum, and explores the state-of-the-art and key advances in specific application domains. The five key areas that will be presented are: 1) the evolution of mobile graphics capabilities; 2) the current trends in GPU hardware for mobile devices; 3) the main software development systems; 4) the scalable visualization of large scenes on mobile platforms; and, finally, 5) the use of mobile capture and data fusion for 3D acquisition and reconstruction.
3D4life PhD Thesis Results
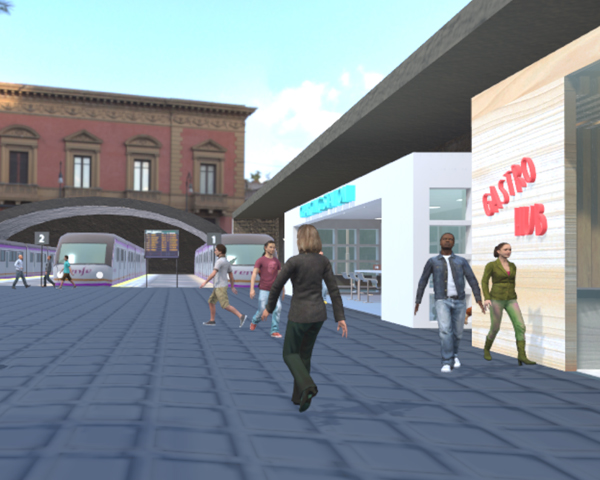
Walking with virtual humans: Understanding human respons to virtual humanoids
PhD. Thesis. February 2022.
Advisors: Pelechano, Nuria
BibTeX
Toward human-like pathfinding with hierarchical approaches and the GPS of the brain theory
PhD. Thesis. November 2020.
Advisors: Pelechano, Nuria
BibTeX
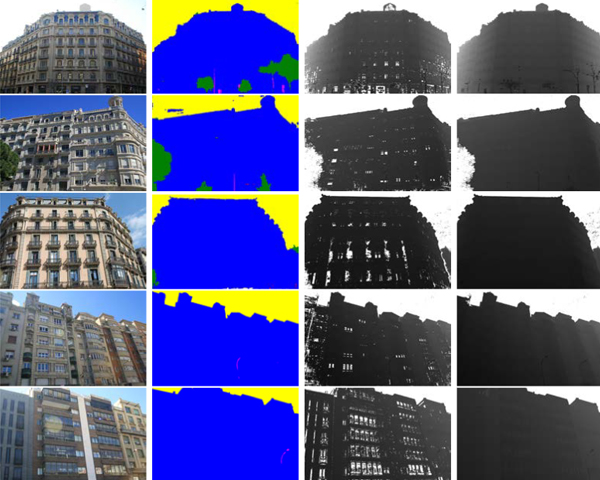
Algorithms for the reconstruction, analysis, repairing and enhancement of 3D urban models from multiple data sources
PhD. Thesis. December 2020.
Advisors: Andújar, Carlos; Chica, Antoni
BibTeX
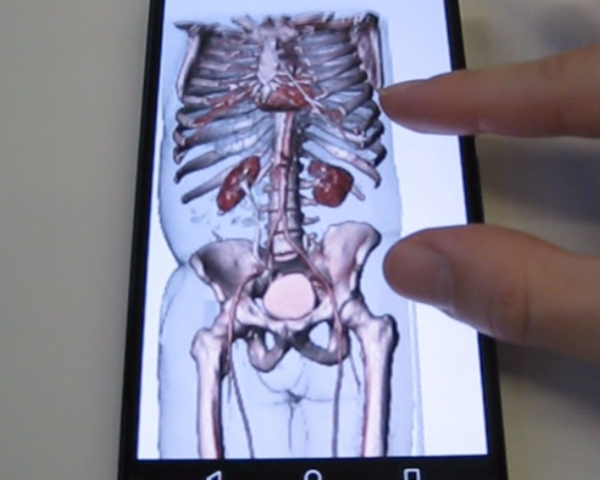
Real-Time Quality Visualization of Medical Models on Commodity and Mobile Devices
PhD. Thesis. May 2018.
Advisors: Vázquez, Pere-Pau; Navazo, Isabel
BibTeX
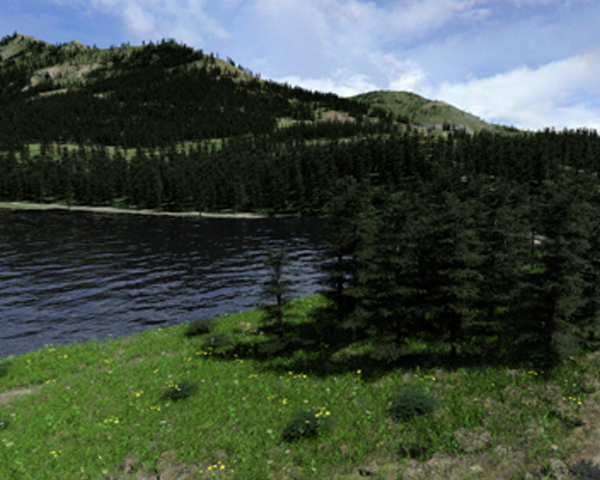
Realistic reconstruction and rendering of detailed 3D scenarios from multiple data sources
PhD. Thesis. July 2018.
Advisors: Andújar, Carlos; Chica, Antoni
BibTeX